Customer Data Visualization
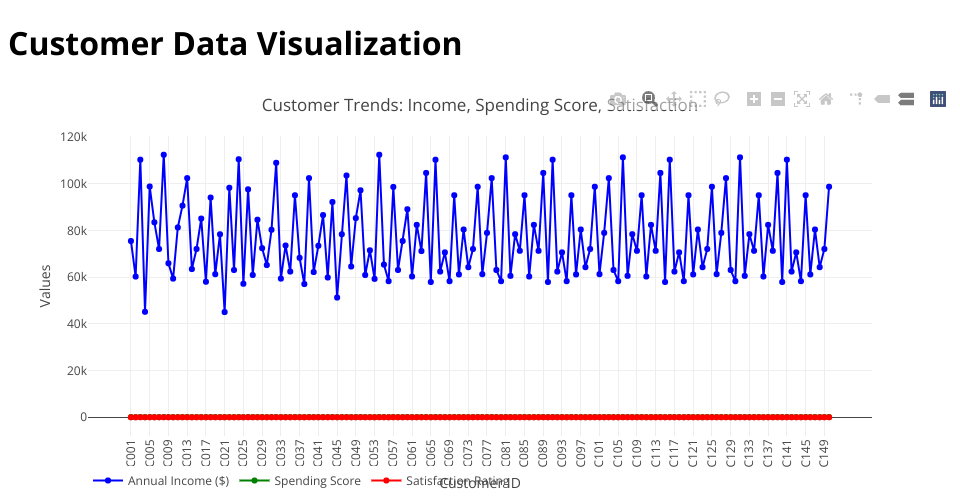
This project visualizes customer data using D3.js to create two charts:
- Multi-Series Line Chart showing trends in Annual Income, Spending Score, and Satisfaction Rating
- Combined Chart (Bar + Line) showing Store Visits (bar) vs Online Purchases (line)
How to Run
- Save all files in the same directory
- Open
index.htmlin a web browser - The visualizations will load automatically
Data
The dataset contains information about 49 customers including:
- Customer ID
- Age
- Annual Income
- Spending Score
- Online Purchases per month
- Store Visits per month
- Satisfaction Rating
MIT Licensed