Sales Area Chart
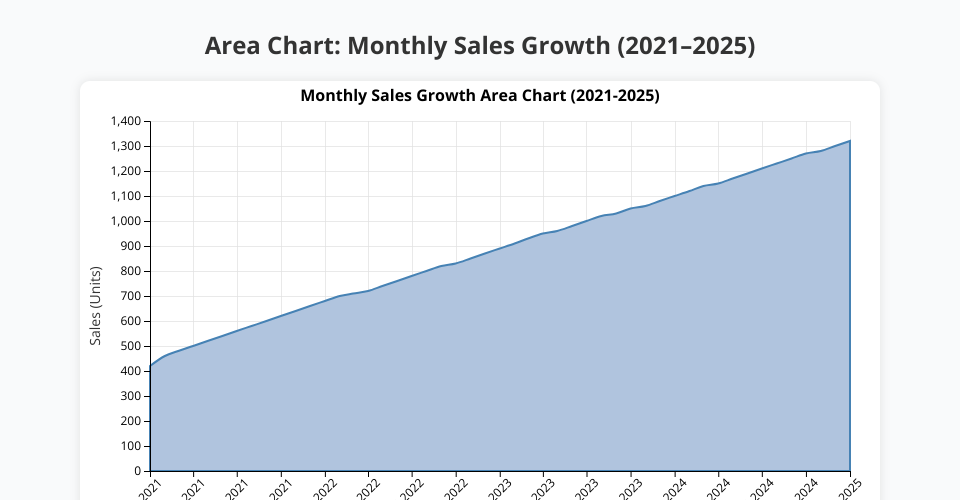
This project visualizes monthly sales data from 2021 to 2025 using a D3.js area chart.
Data
The data is stored in sales_area.csv with two columns:
month: Month and year in "MMM-YYYY" formatsales: Sales figures in units
Implementation
The visualization includes:
- Area chart showing sales growth over time
- Grid lines for better readability
- Properly formatted axes with labels
- Responsive design with clean styling
MIT Licensed