Ecosystem Network Visualization
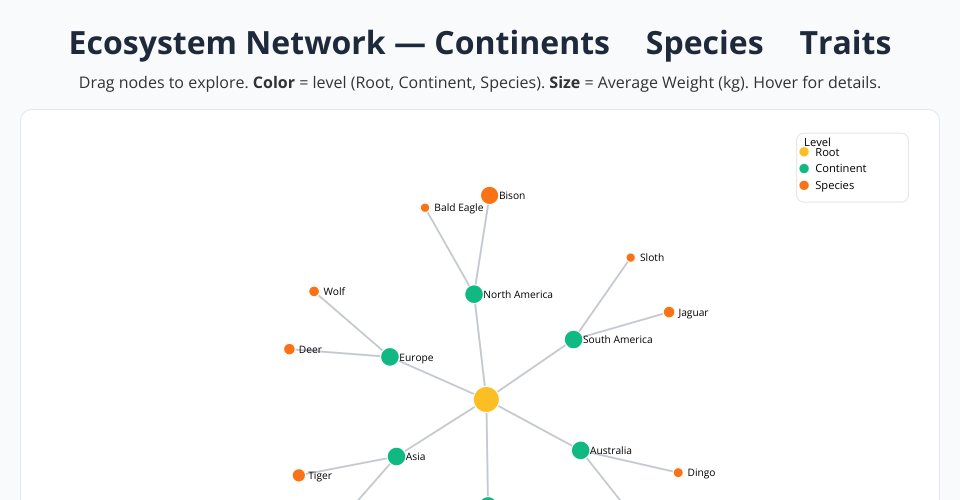
An interactive D3.js visualization displaying the relationships between continents, species, and their traits.
Features
- Interactive Network Graph: Drag nodes to explore relationships
- Color-Coded Levels: Root (yellow), Continent (green), Species (orange)
- Node Sizing: Proportional to average weight
- Hover Details: View comprehensive species information
- Force Simulation: Physics-based layout for optimal positioning
Project Structure
index.html- Main HTML filestyles.css- Stylesheetindex.js- Entry point (ES6 modules)data.js- Dataset managementnetwork.js- D3 network visualization logic
Running
Open index.html in a modern browser or serve locally with
a web server.
MIT Licensed