World Automobile Metrics Map (2024)
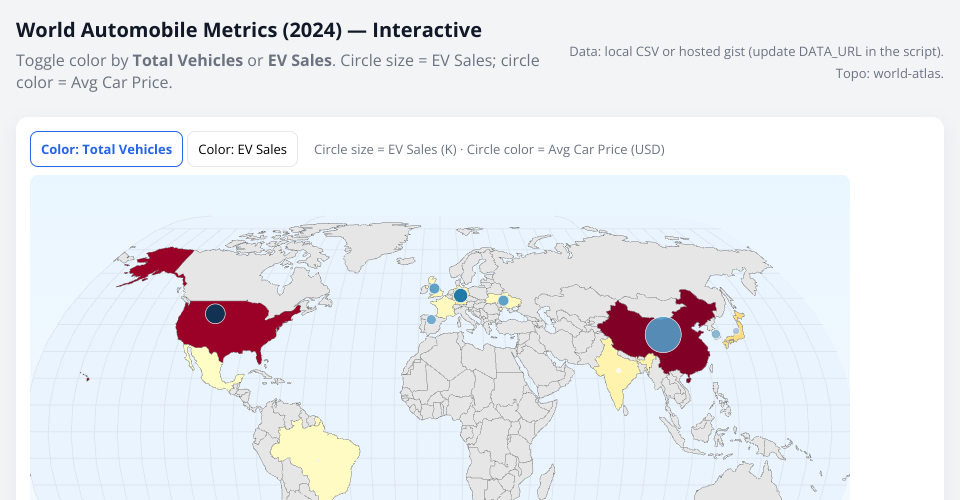
An interactive D3.js world map visualization of automobile metrics including total vehicles, EV sales, and average car prices by country.
Features
- Interactive Map: Hover over countries to see detailed metrics
- Toggle Visualization: Switch between coloring by Total Vehicles or EV Sales
- Circle Visualization: Circle size represents EV Sales, color represents Average Car Price
- Responsive Design: Adapts to different screen sizes
- Legend: Dynamic legend updates based on selected metric
Data
The visualization includes data for 10 major automotive markets (USA, China, Japan, Germany, UK, France, India, Brazil, Mexico, South Korea).
To use your own CSV data:
- Update the
INLINE_CSVvariable in the script or - Set
DATA_URLto point to your hosted CSV file
Technologies
- D3.js v7
- TopoJSON for geographic data
- world-atlas (countries-110m.json)
How to Use
- Open
index.htmlin a browser - Hover over countries to see metrics
- Click buttons to toggle color scheme between Total Vehicles and EV Sales
MIT Licensed