Work in progress. For best results, view on an extremely large screen!
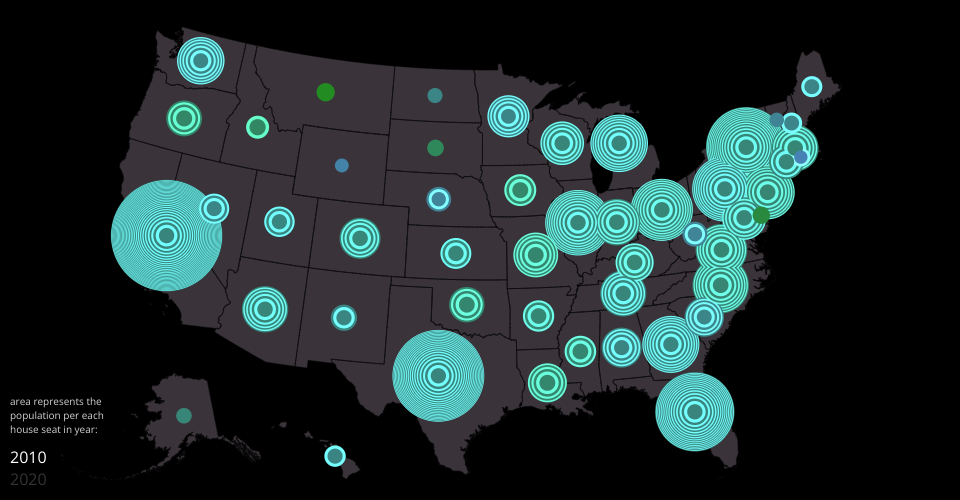
Visualizing the reapportionment of House of Representatives seats following the 2020 census. Some background on the concept of reapportionment from CNN: https://www.cnn.com/2021/04/26/politics/us-census-2020-results/index.html
The overall size of the circle for each state represents the total population of the state. The rings within each circle show the number of representatives for that state (such that the amount of area covered by each ring is proportional to the number of people represented by each house seat). Thus, larger rings show cases where the state has more than the average number of people per seat (most noticable by looking at the different sizes of the innermost ring). So in 2010 Montana was one of the most underrepresented states (it had the most people per house seat) but in the 2020 reapportionment it is now one of the most overrepresented.
The colors also encode this information: greener circles are have more people per seat, and bluer circles have fewer people per seat. (The alternating pale rings are just to make it easier to see the total number of seats).
Notice how some states get larger in overall population but still lose seats, like California and New York.
Data:
https://www.census.gov/data/tables/2020/dec/2020-apportionment-data.html https://www.census.gov/data/tables/2010/dec/2010-apportionment-data.html
Combined data here:
https://gist.github.com/almccon/ae281423e3bbaa1cf17b70d2414f931f