Iris Dataset Scatter Plot Visualization
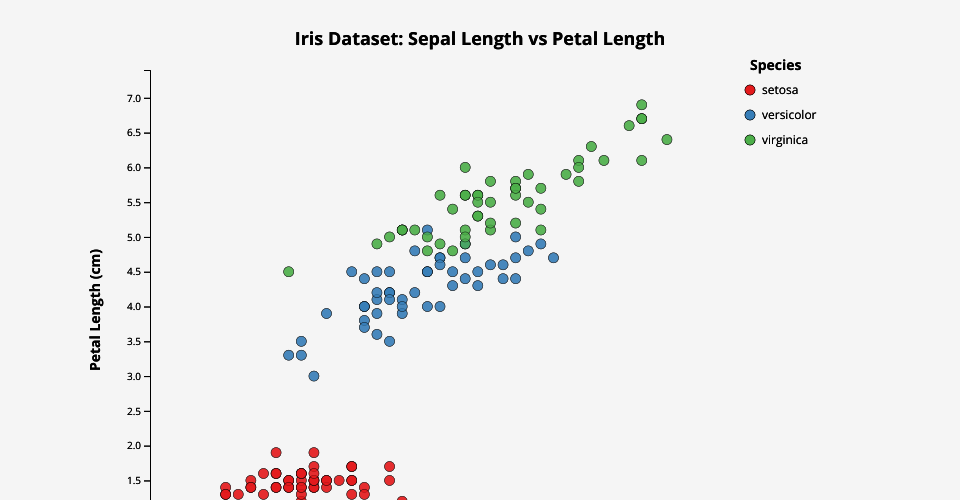
This project visualizes the Iris dataset using D3.js to create a scatter plot showing the relationship between sepal length and petal length, with points colored by species.
How to Run
- Clone or download this repository
- Open
index.htmlin a web browser - The visualization will load automatically
Features
- Scatter plot of sepal length vs petal length
- Points colored by species
- Interactive hover effects
- Responsive design
- Clean, modern styling
Data Source
The visualization uses the Iris dataset from https://raw.githubusercontent.com/datasets/iris/master/data/iris.csv
Technologies Used
- D3.js v7
- HTML5
- CSS3
MIT Licensed