World Happiness Report - 2024
Dataset link: https://www.kaggle.com/datasets/jainaru/world-happiness-report-2024-yearly-updated
[UPDATE] Identify tasks:
- Show the geographic distribution of the "ladder score" (happiness score)
- Explore the correlations between (score, log GDP per capita), (score, healthy life expectancy), (score, social support), and (score, freedom to make life choices)
- See the distribution of number of countries in certain score ranges
- Identify the countries with a higher score than some threshold
- Show the average score in each region
The World Happiness Report is a landmark survey of the state of global happiness . The report continues to gain global recognition as governments, organizations and civil society increasingly use happiness indicators to inform their policy-making decisions. Leading experts across fields – economics, psychology, survey analysis, national statistics, health, public policy and more – describe how measurements of well-being can be used effectively to assess the progress of nations. The reports review the state of happiness in the world today and show how the new science of happiness explains personal and national variations in happiness.
Here's a brief explanation of each column in the dataset:
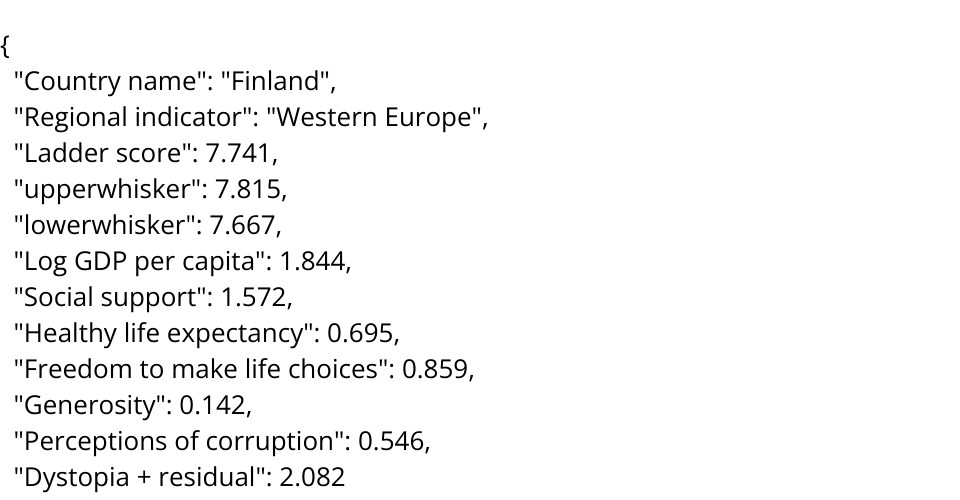
- Country name: Name of the country.
- Regional indicator: Region to which the country belongs.
- Ladder score: The happiness score for each country, based on responses to the Cantril Ladder question that asks respondents to think of a ladder, with the best possible life for them being a 10, and the worst possible life being a 0.
- Upper whisker: Upper bound of the happiness score.
- Lower whisker: Lower bound of the happiness score.
- Log GDP per capita: The natural logarithm of the country's GDP per capita, adjusted for purchasing power parity (PPP) to account for differences in the cost of living between countries.
- Social support: The national average of binary responses(either 0 or 1 representing No/Yes) to the question about having relatives or friends to count on in times of trouble.
- Healthy life expectancy: The average number of years a newborn infant would live in good health, based on mortality rates and life expectancy at different ages.
- Freedom to make life choices: The national average of responses to the question about satisfaction with freedom to choose what to do with one's life.
- Generosity: The residual of regressing the national average of responses to the question about donating money to charity on GDP per capita.
- Perceptions of corruption: The national average of survey responses to questions about the perceived extent of corruption in the government and businesses.
- Dystopia + residual: Dystopia is an imaginary country with the world’s least-happy people, used as a benchmark for comparison.
The dystopia + residual score is a combination of the Dystopia score and the unexplained residual for each country, ensuring that the combined score is always positive.
Each of these factors contributes to the overall happiness score, but the Dystopia + residual value is a benchmark that ensures no country has a lower score than the hypothetical Dystopia.