AI Models Interactive Dashboard
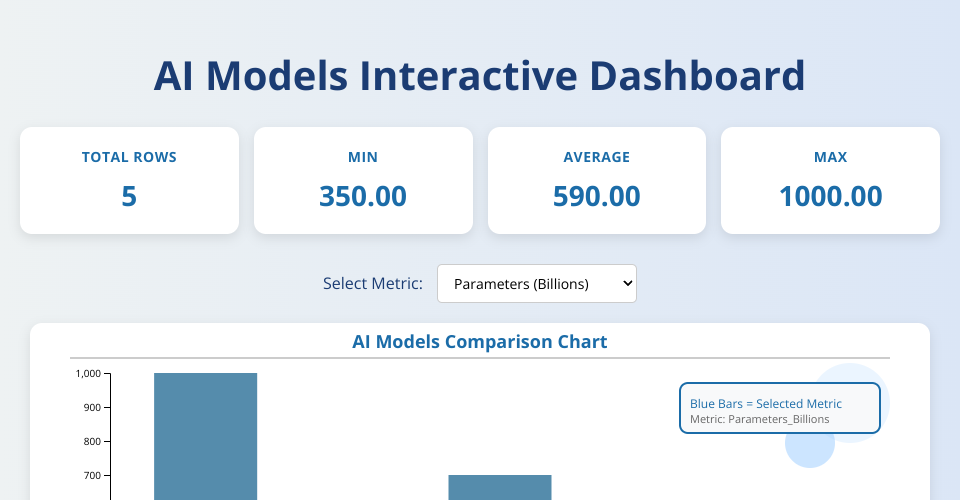
A D3.js-based visualization dashboard for AI models dataset with interactive features and modular architecture.
Features
- Interactive Bar Chart Visualization - Dynamic bar chart with smooth animations
- Summary Statistics Cards - Display min, max, average values, and total row count
- Metric Selector - Switch between different data metrics dynamically
- Tooltip Hover Information - View detailed model information on hover
- Responsive Design - Clean, modern card-based layout that works on mobile devices
- Decorative Elements - Enhanced visual appeal with dividers and accent circles
- Modular Architecture - Separated concerns with dedicated modules
- Error Handling - Graceful error messages and validation
- Accessibility - ARIA labels and semantic HTML
Files
index.html- Main HTML structure with semantic markupstyles.css- Dashboard styling, layout, and responsive designindex.js- Main application entry pointconfig.js- Centralized configuration for the applicationchart.js- D3.js chart visualization logicstats.js- Statistics panel management
Data Source
Uses the AI Models dataset from the provided CSV URL.
Usage
Open index.html in a web browser to view the dashboard.
Use the metric selector dropdown to switch between different
data views.
Architecture
The application is organized into modular components:
- Config: Centralized configuration for all constants
- Chart: Handles all D3.js visualization logic
- StatsPanel: Manages summary statistics display
- index.js: Coordinates data loading and component interaction
Installation
- Clone the repository
- Open
index.htmlin a modern web browser - No build process required - uses ES6 modules directly
Browser Support
Requires modern browsers with ES6 module support:
- Chrome/Edge 63+
- Firefox 67+
- Safari 11.1+
Performance
- Efficient D3 data binding with unique keys
- Smooth animations (1000ms transitions)
- Optimized SVG rendering
- Responsive design with CSS media queries
MIT Licensed
Comments
nice