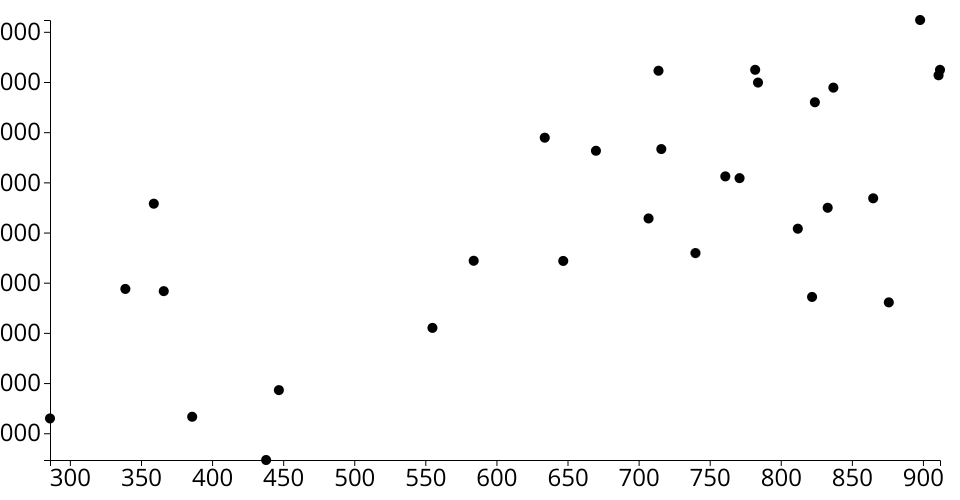
A vanilla HTML implementation of a D3 scatter plot. Shows the CDC Dataset.
Sourced from CDC as of 4/1/2021
- Shows more deaths from more infected cases
- Each dot is 14 Day moving average
MIT Licensed
A vanilla HTML implementation of a D3 scatter plot. Shows the CDC Dataset.