Music Track Visualization
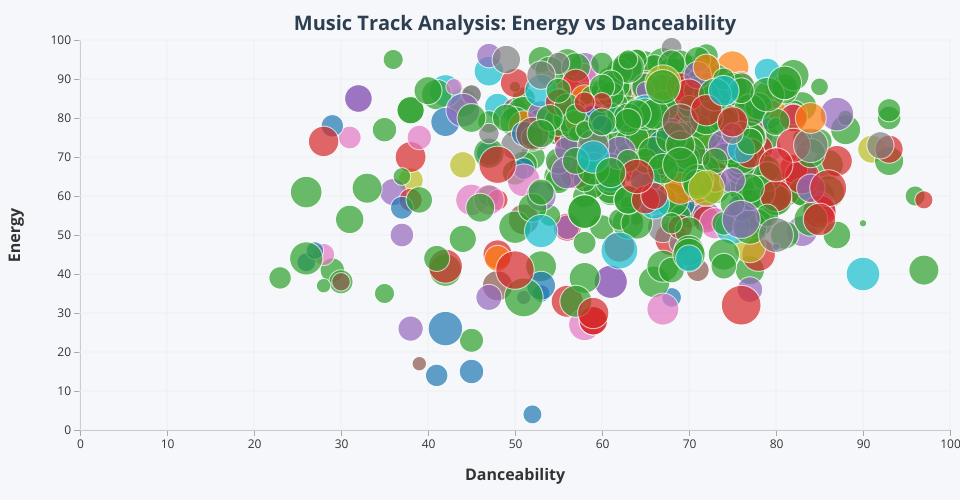
An interactive data visualization of popular music tracks using React and D3.js. This visualization shows the relationship between danceability and energy of songs, with bubble size representing popularity and color representing genre.
Features
- Scatter plot visualization with D3.js
- Bubble chart showing track attributes
- Color-coded by genre
- Interactive tooltips with track information
- Responsive design
Data
The visualization uses a dataset of popular music tracks from 2010 with the following attributes:
- Danceability (dnce): How suitable a track is for dancing (0-100)
- Energy (nrgy): Intensity and activity of the track (0-100)
- Popularity (pop): Popularity score (0-100)
How to Run
- Clone this repository
- Open
index.htmlin a web browser
Implementation Details
- Uses native ES modules with import maps
- No build step required
- Data loaded from local CSV file
- Built with React 19 and D3.js v7
MIT Licensed