0 views in last 90 days
Thomas Seberechts
@Tseberechts
Public vizzes

Selecting a year on a line chart

Melting Data form Multiple Lines

Line chart with multiple lines
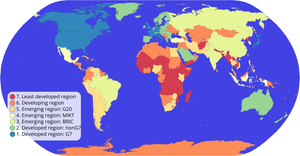
Choropleth Map with Interactive Filtering

Chloropleth Map

Scatter Plot With Menus
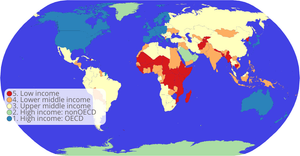
Chloropleth Map
Cheap Tricks for Interaction
Cheap Tricks for Interaction
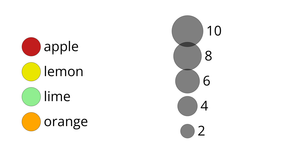
Color and Size Legends
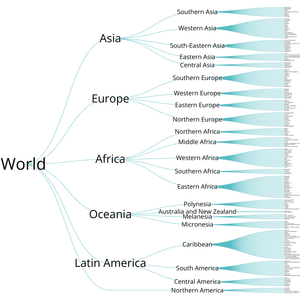
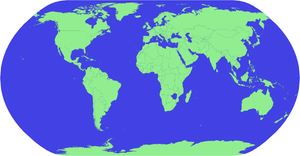
World countries tree

Blank Canvas
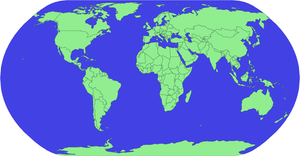
Let's make a map with D3.js!
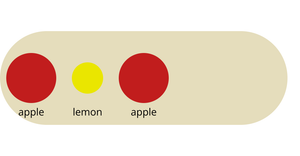
Bowl of Fruit - Hover to select

Bowl of Fruit - Click to select

Bowl of Fruit - General Update Pattern

World Population Area Chart

Temperature in San Fransisco Line Chart

Temperature in San Fransisco Line Chart

Temperature in San Fransisco Scatter Plot

Cars Scatterplot
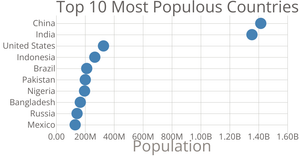
Scatter Plot
Customizing Axes
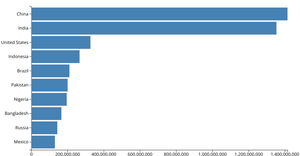
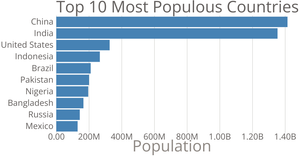
Making a Bar Chart

Let's make a face with D3.js!
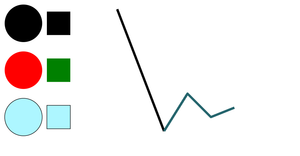
Shapes with SVG and CSS