Resources
Contact
Pricing
🇺🇸
EN
Log in
Open Editor
Revision History
Export Image
Share
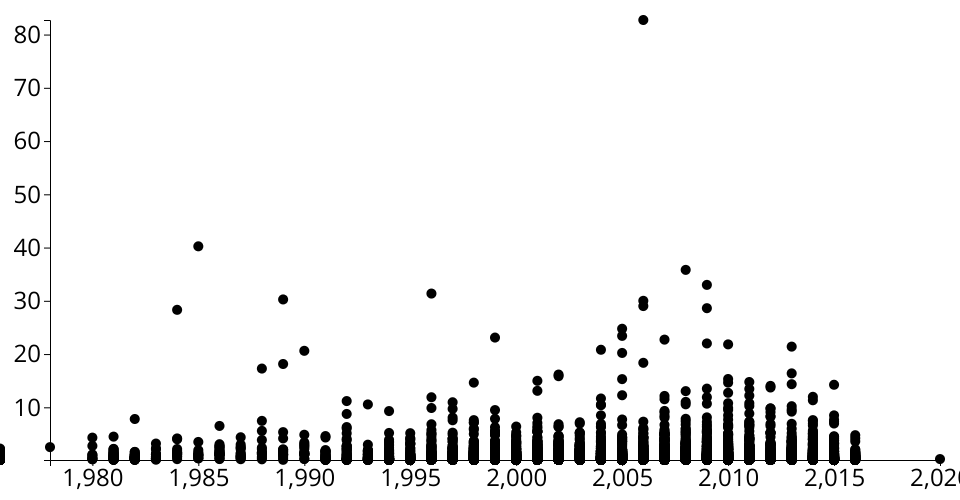
D3 Scatter Plot of Top Video Game Sales showing Release Year (X) vs. Global Sales in Millions (Y)
1
Fork
0
Likes
T-Reiser
0 views in last 90 days
Last edited Sep 15, 2021
Created on Sep 15, 2021
Forked from
D3 Scatter Plot of Top 5000 TMDB Movies showing Runtime(X) vs. Budget(Y)
uses
v1 runtime
A vanilla HTML implementation of a D3 scatter plot. Shows the
Top Video Games Sales
.
MIT Licensed