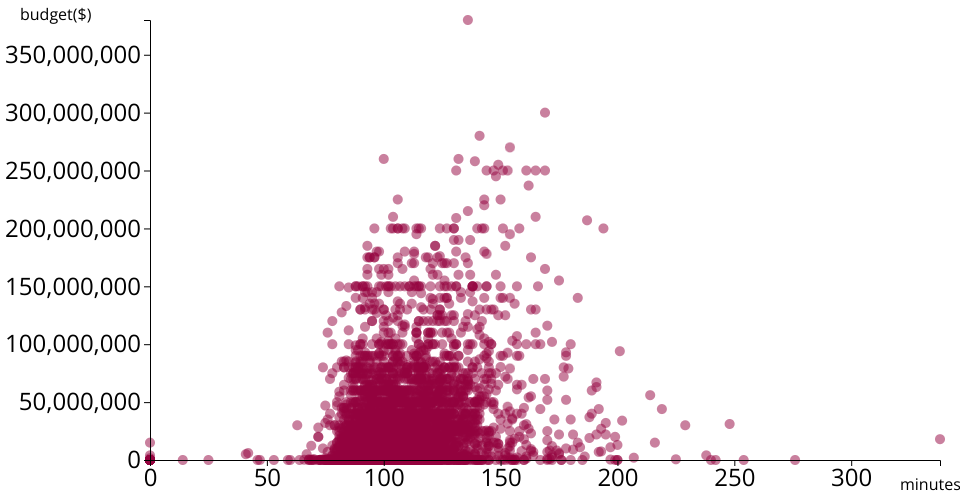
An improved implementation of a D3 scatter plot. Shows the Top 5000 TMDB Movies.
This revision pushed the margins out to allow for the full y-axis values to be viewed, and also labeled the axes better. The main addition in this improvment however, is the addition of more transparent scatter points that have also been colored. This was a suggestion made by someone in the class a while ago, and allows the reader to see overlapping dots and the density of where many movies runtimes are layed out. This provides more information to the reader and is more pleasing to look at. I originally looked to reduce the circle radius, to allow the middle to look less congested, however the smaller dots are harder to read.
MIT Licensed