Resources
Contact
Pricing
🇺🇸
EN
Log in
Open Editor
Revision History
Export Image
Share
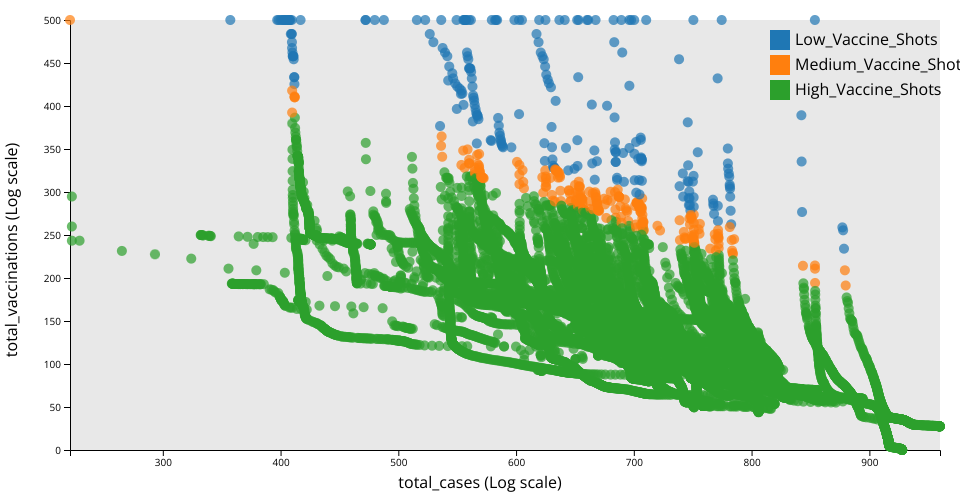
Scatter Plot Covid Project
1
Fork
0
Likes
SushmaN04
0 views in last 90 days
Last edited Apr 25, 2024
Created on Apr 25, 2024
Forked from
Covid Cases and Deaths WorldWide Simple Scatter Plot
uses
v3 runtime
A scatter plot with D3 showing between total cases of covid and total vaccinations of covid.
MIT Licensed