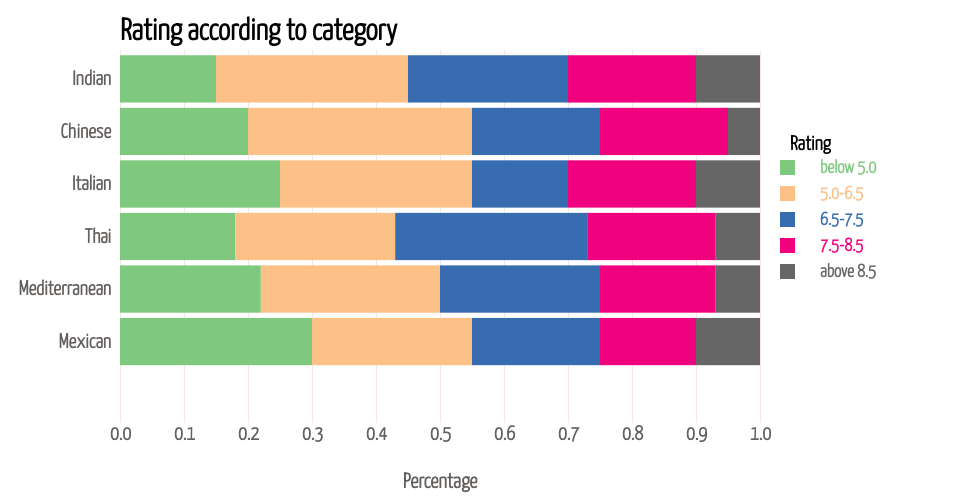
The impact of category on ratings
This stacked bar chart gives the percentage of each rating level within different categories. The aim is to show the impact of category on ratings. When the mouse hovers over each bar, you can see pop-ups of accurate percentages of each rating level within each category. The total percentage is 1, representing 100%
MIT Licensed