Resources
Contact
Pricing
🇺🇸
EN
Log in
Open Editor
Revision History
Export Image
Share
Area Chart
0
Forks
0
Likes
Sheela2930
0 views in last 90 days
Last edited Apr 09, 2023
Created on Apr 09, 2023
Forked from
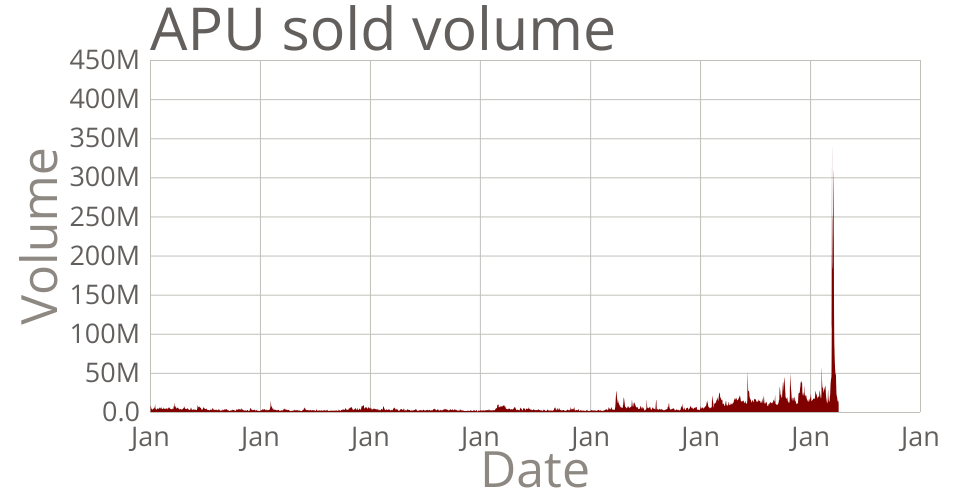
Area Chart of APU stock volume historically
uses
v2 runtime
This line chart shows data about closed price of APU in 2019 and 2020.
MIT Licensed