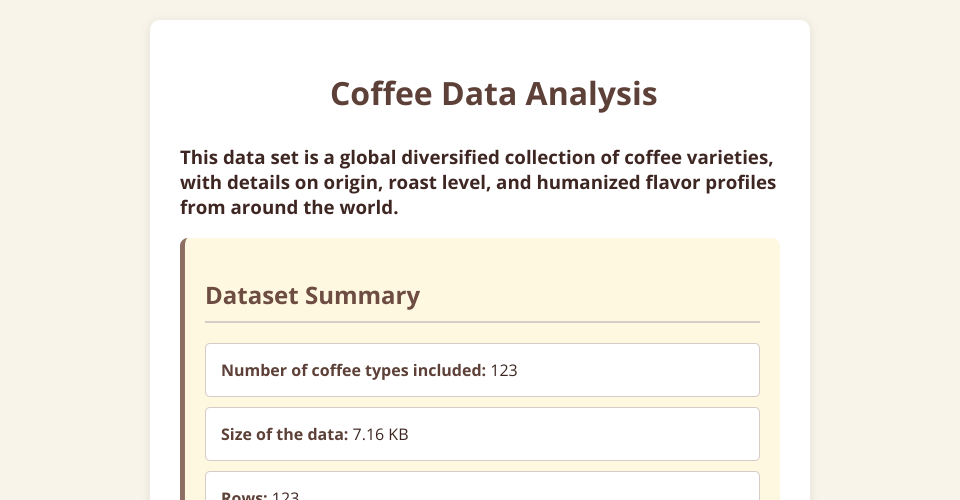
My project involves creating a custom dataset and plotting it on an HTML webpage. I created a dataset for popular coffee types, like origin, roast level, and flavor profile. I put this data out in the open on GitHub Gists to obtain a permanent URL. I used VizHub to build an HTML webpage that uses the D3.js library to access and load this CSV data. The page performs calculations on the data to display an overview (like the quantity of coffees and unique origins) and displays the information of each coffee listed. I have also created the page with a coffee-themed color scheme via CSS and added a personalized hand-drawn SVG coffee mug image to enhance the visualization's appearance.
MIT Licensed