Population Data Visualization
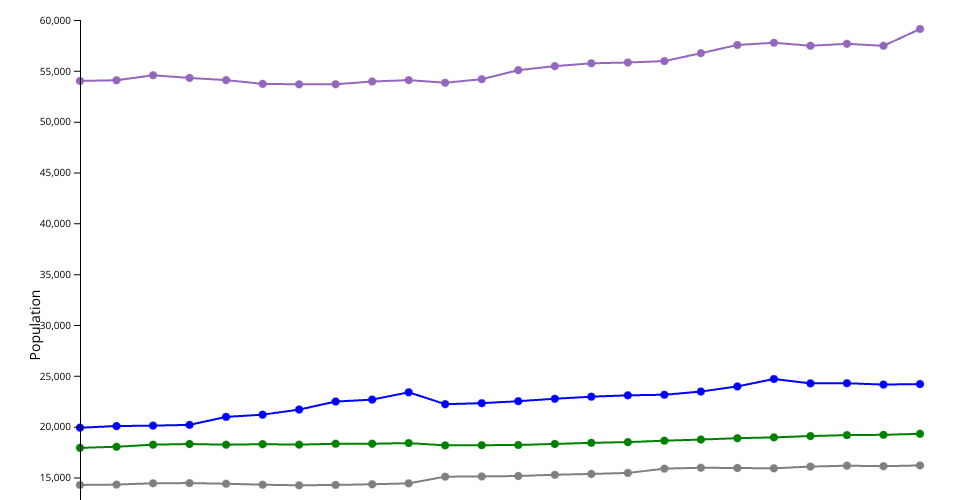
This project visualizes population trends for several Massachusetts towns from 2000-2023 using React and D3.js.
Data Sources
- Hull.csv
- Hingham.csv
- Scituate.csv
- Cohasset.csv
- Duxbury.csv
- Weymouth.csv
- Norwell.csv
- Abington.csv
Each CSV file contains:
- Year: Census year
- Population: Town population for that year
- Year on Year Change: Absolute change from previous year
- Change in Percent: Percentage change from previous year
Features
- Line chart showing population trends over time
- Interactive data points
- Color-coded towns for easy comparison
- Legend with town names
- Properly formatted axes with commas for population values
MIT Licensed