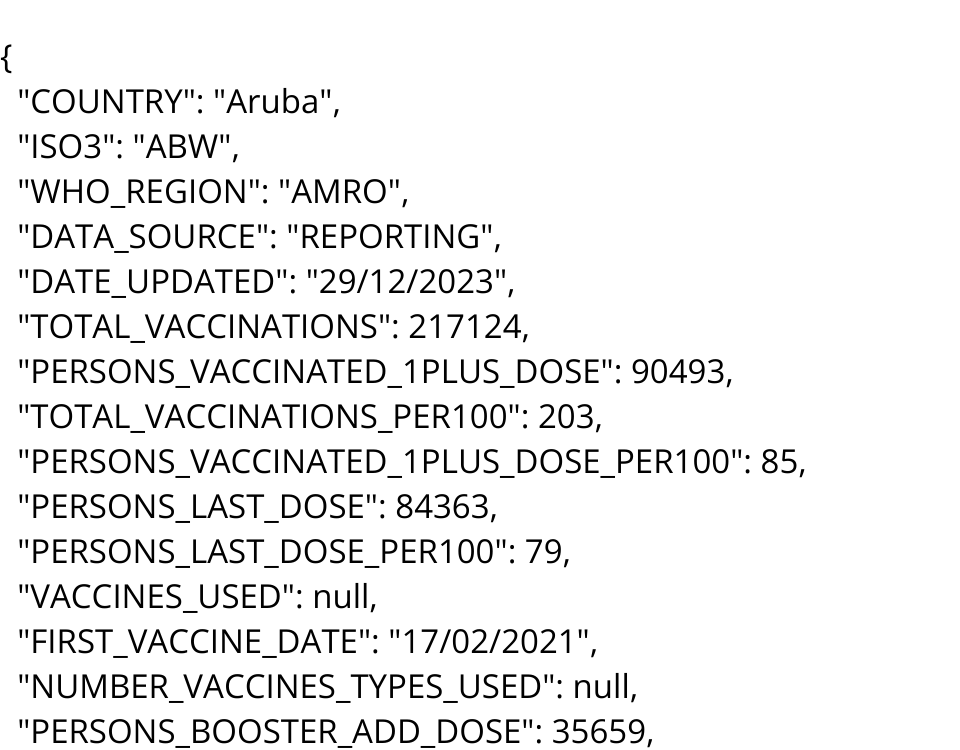
COVID-19 Vaccine Data From: https://www.kaggle.com/datasets/abdoomoh/daily-covid-19-data-2020-2024
Five Possible Tasks:
The following lists five
possible data visuaulization tasks that can be done with the
COVID-19 Vaccine dataset following the {action, target}
paradigm.
- Indentify the countries with the higest ratio of booster doses to initial vaccinations
- Present the vaccine data in terms of the WHO_REGION attribute
- Discover if there is correlation between the WHO_REGION and vaccination rate
- Annotate a map of the world with the vaccine rate overlaid over each country with each countries color corresponding to the relative value (HIGH, MED, LOW)
- Present the number of vaccinations for each country on a timeline where each country starts at a point on the timeline corresponding to the FIRST_VACCINE_DATE
MIT Licensed