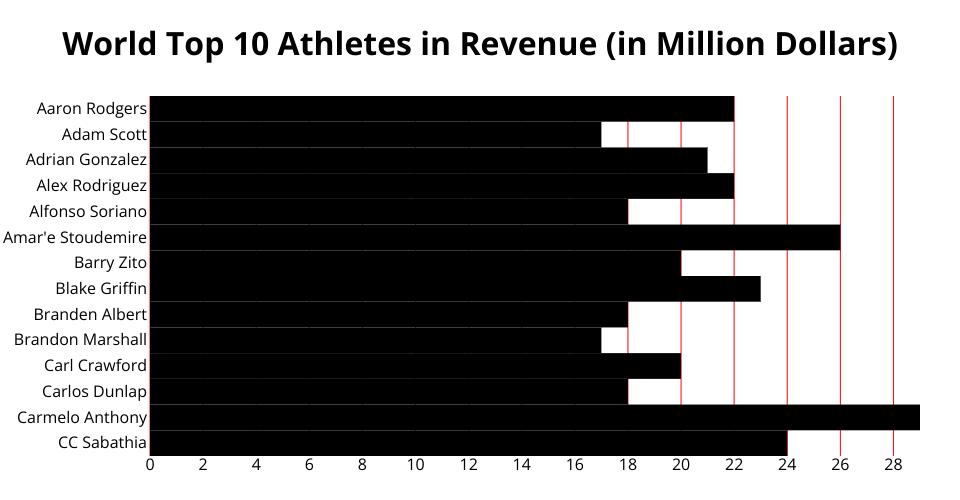
This bar chart shows population of the top 10 most revenue atheletes. It also demonstrates customization of D3 axes.