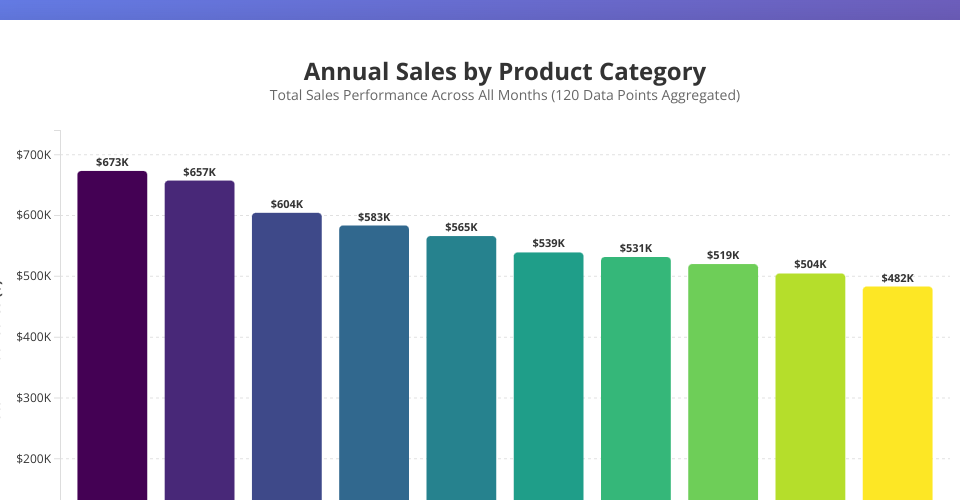
Bar Chart Visualization
This project creates a simple bar chart using D3.js to visualize sample data.
How to Run
- Open
index.htmlin a web browser - The bar chart will be displayed with sample data
Features
- Responsive bar chart with hover effects
- X and Y axes with labels
- Chart title
- Uses D3.js for visualization
MIT Licensed