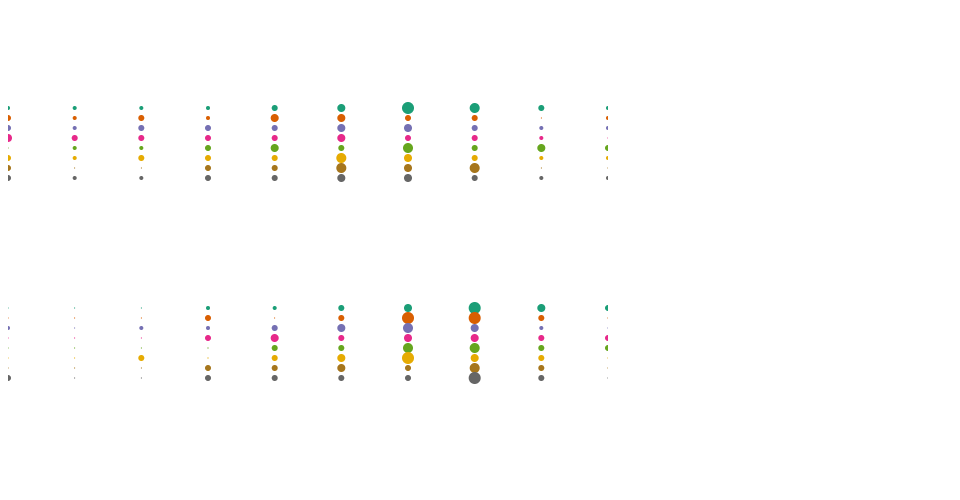
A special scatterplot with d3
This scatterplot has two groups of circles divided on the y-axis depending on a variable in the data
Within each group each country is represented by a color and separated from other countries on the y axis
This way you can see the distribution within each country
MIT Licensed