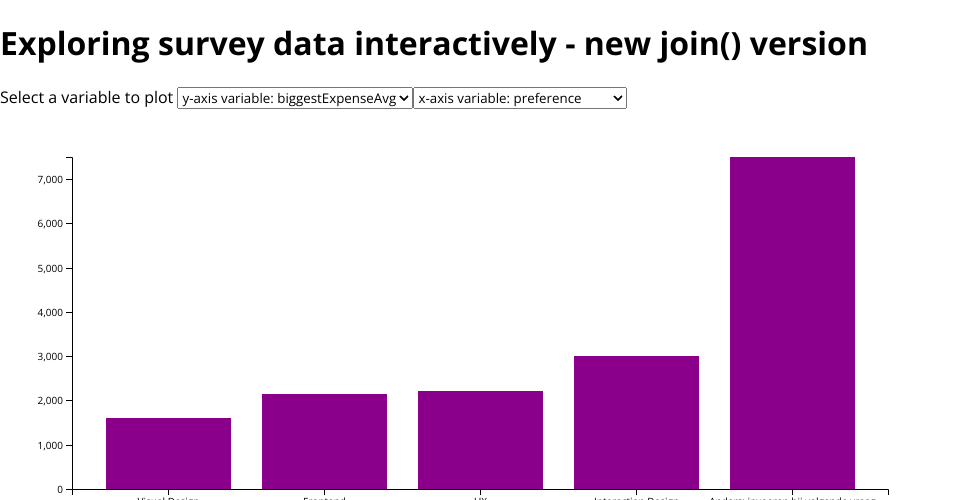
Dynamic axes using the update pattern example with JOIN
In this visualization, the data that's rendered in the view changes because of user interaction Testing the new join() version.
Steps
- Make the nesting dynamic
- Nest on health, stress dynamically
- Make x-axis interactive so remove and enter are also needed
Concept
A chart showing distribution or relation between to variables. The vriables can be chosen through a dropdown menu resulting in a rerendering of datapoints and axis.
- Group students by a variable on the x axis.
- Get data from different vars on y axis
Notes
- Note that d3 has a new way of handling enter, update and exit explicitly as explained in this article.
- The options in the form are generated from the data using a data join
- The scales, the data and the selected opton are global. I found that to be nicer than to keep passing them everywhere
- If you want to add a new option to this interactive graph, all you have to do is add a new computed variable in the prepareData module and everything else will happen automatic
- Observe how prepareData module now exports 2 functions separately which we can use to have greater control over the transformation of data from our index.js file.
Inspiration
MIT Licensed