Reusable Scatter Plot: Car Price vs. Horsepower
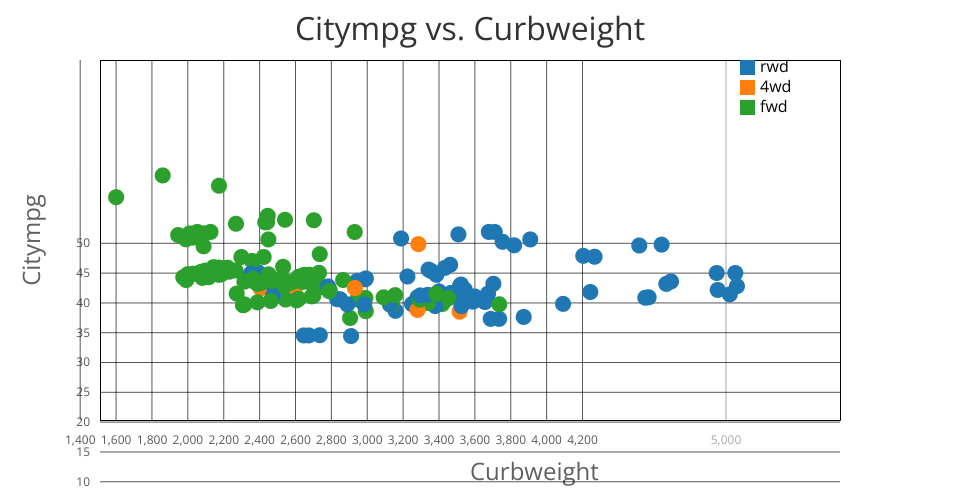
This visualization is a reusable scatter plot created with D3.js. It displays the relationship between the horsepower of a car and its price, using the Car Price dataset.
MIT Licensed
This visualization is a reusable scatter plot created with D3.js. It displays the relationship between the horsepower of a car and its price, using the Car Price dataset.