Enhanced Scatter Plot
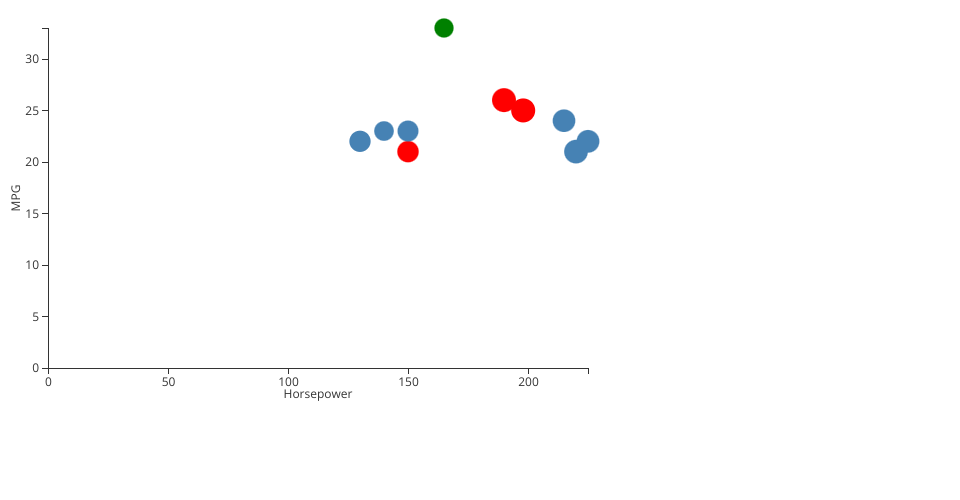
This HTML file creates an interactive scatter plot using D3.js library to visualize data points from the Cars dataset. It displays the relationship between horsepower and MPG (miles per gallon) of cars, with additional information such as origin and weight. Each data point is represented by a circle, with size corresponding to weight, and color indicating the origin of the car (USA, Japan, or Europe).
MIT Licensed