#Political popularity can be affected by a topic.
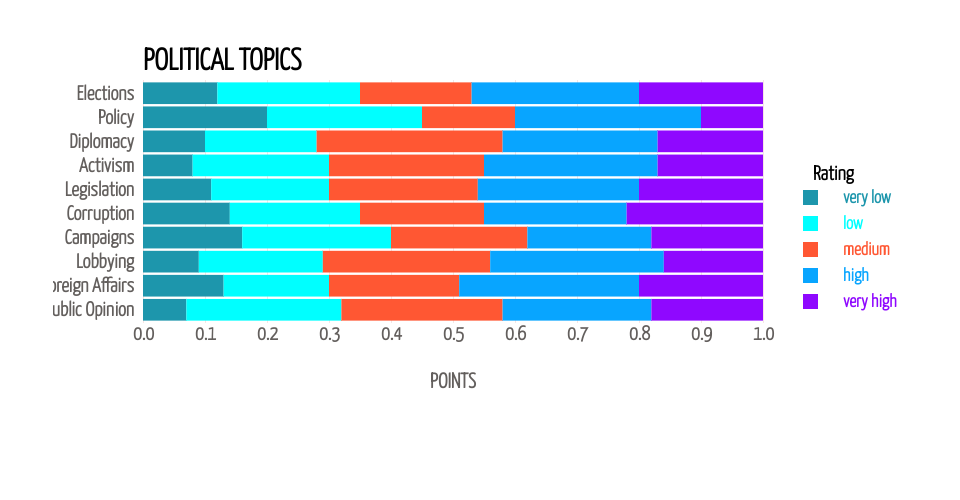
In the present case, the bar graph illustrates the proportionate Classification judgments on political matters. Each bar marks a political subject and each is broken up by ratings (ranging from very low to very high). Each bar height is 1, i.e., 100% displaying a graph of the distribution of a given subject's ratings.
It assists in visualizing the way different political issues are rated or viewed at various levels of scores.
MIT Licensed