Resources
Contact
Pricing
🇺🇸
EN
Log in
Open Editor
Revision History
Export Image
Share
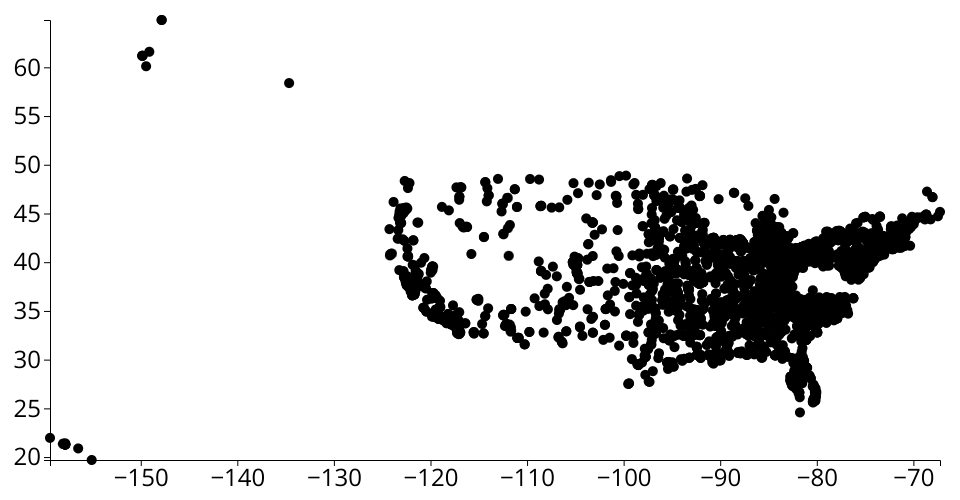
D3 Scatter Plot - Postsecondary Schools
1
Fork
0
Likes
Philip Rago
0 views in last 90 days
Last edited Sep 30, 2021
Created on Sep 16, 2021
Forked from
D3 Scatter Plot
uses
v1 runtime
A scatter plot of X,Y coords for Postsecondary schools around the US.
Learn more about the data
here
MIT Licensed