Resources
Contact
Pricing
🇺🇸
EN
Log in
Open Editor
Revision History
Export Image
Share
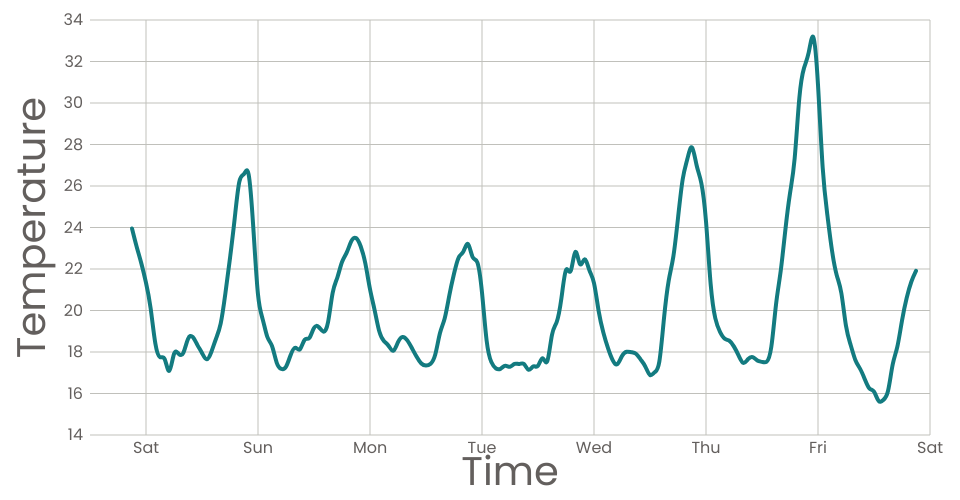
Line Chart
0
Forks
0
Likes
PatrickhCahill
0 views in last 90 days
Last edited Apr 18, 2022
Created on Apr 18, 2022
Forked from
Stylized Line Chart
uses
v2 runtime
A scatter plot of
Data Canvas Sense Your City Dataset
.
MIT Licensed