
CSCE 5320 HW7 - Arranging emissions
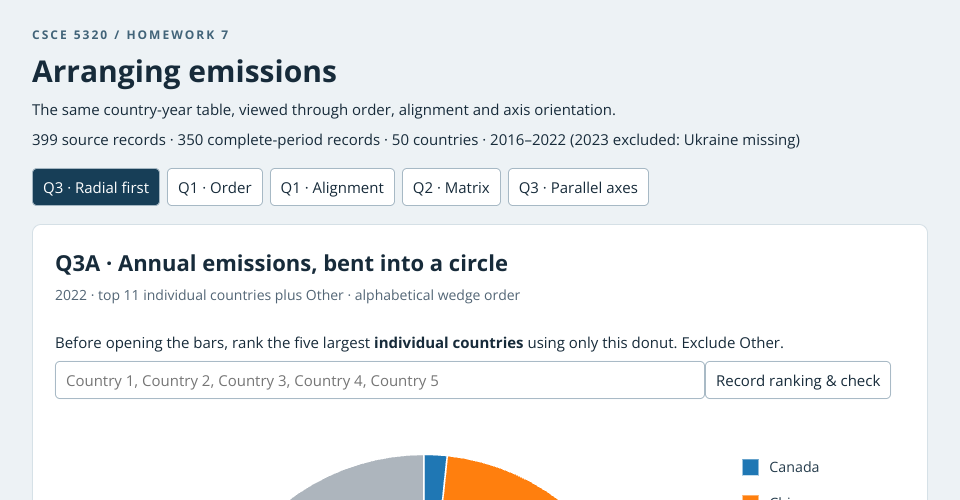
Interactive comparisons of country order, stacked/grouped alignment, matrix row order, and radial/parallel axis orientation. Use the chart-family buttons and order controls. The donut opens first for an optional visual top-five ranking; numeric labels are withheld until the ranking check.
Data and scope
Public dataset gist. The supplied HW7 fallback has 399 records, 50 countries, 2016-2023, seven regions, and six quantitative measures. Ukraine lacks 2023, so the charts use the complete 2016-2022 panel (350 rows) and 2022 snapshots (50 rows). No missing values are imputed. The CSV is instructional sample data; original statistical provenance and the GDP currency/energy unit conventions were not supplied.
Arrangement decisions
- Q1: total CO2 bars ordered alphabetically, by 2022 magnitude, or by 2016-2022 percentage change. Heights and scale stay fixed.
- Q1: stacked/grouped bars share all 350 values, year colours and the same zero-based scale.
- Q2: per-capita CO2 matrix; row mean changes row order only. Chronological columns and colour domain [0.03, 25.24] stay fixed.
- Q3: top 11 countries plus Other (39 countries); shares refer to this sample.
- Q3: four independently scaled parallel axes; swapping energy and CO2 retains country membership, colours and opacity.
The reported radial test is an assistant observation, not a student response or a controlled blind human experiment. Its recorded order was China, United States, India, Russia, Japan: 5/5 positions correct, no swaps. Source rows had been inspected during preparation.
Reproducibility and attribution
The complete application is in index.html and loads D3 7.8.5 plus the pinned raw gist. The unused index.js and styles.css are inherited template files. For local use, serve the folder over HTTP; no build step is required. Query parameters view, mode and capture=1 support figure capture.
Adapted from the supplied starter7.html and Mike Bostock, Towards Reusable Charts. Additional views use official D3 documentation. The publishing container was forked from Curran Kelleher, HTML Starter. Code, analysis and report preparation received AI assistance.