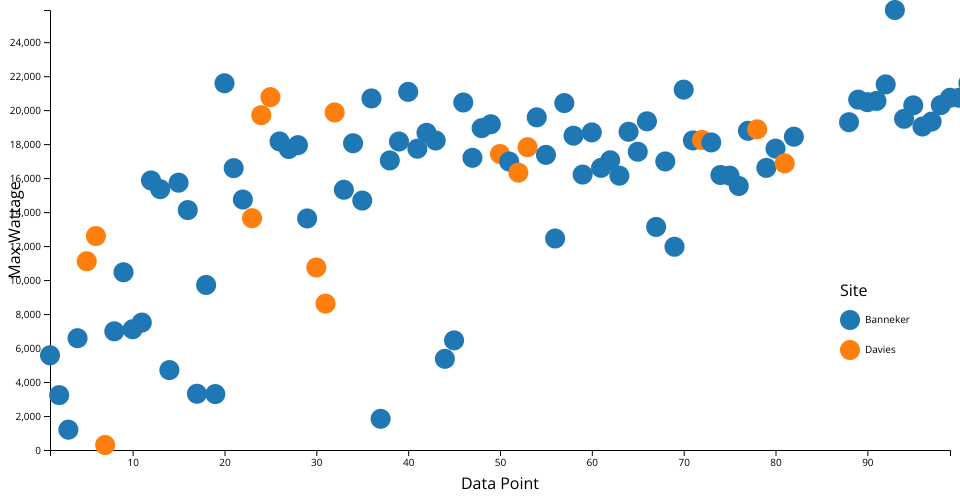
A scatter plot of solar data from (https://www.kaggle.com/datasets/mattop/daily-solar-power-generation?resource=download)
wherein the y axis is the maximum wattage gotten on a particular data point and the x axis is the data point number (i.e. the date)
MIT Licensed