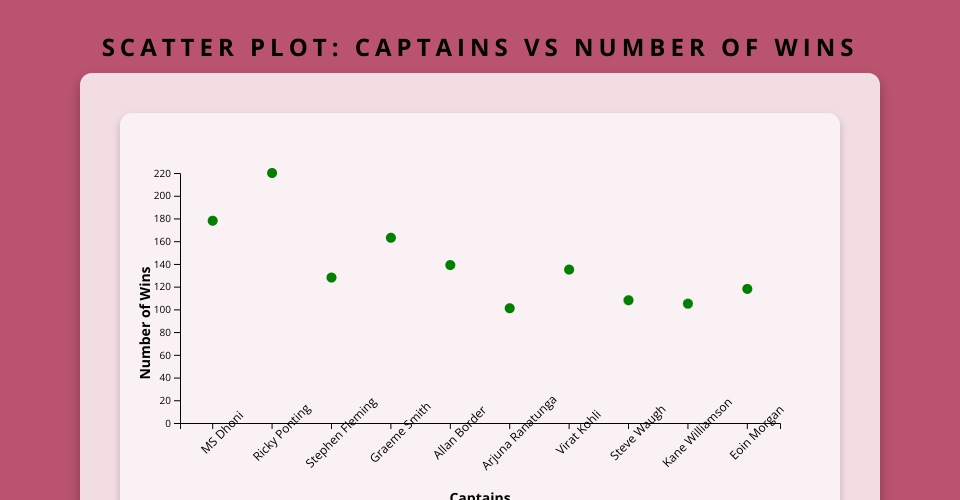
For ICE-6, This scatter plot visualizes the number of wins
by different cricket captains.
The X-axis represents the captain names, while the Y-axis
shows their total wins.
MIT Licensed
For ICE-6, This scatter plot visualizes the number of wins
by different cricket captains.
The X-axis represents the captain names, while the Y-axis
shows their total wins.