The data I used for making this datavis was downloaded from USGS.gov.
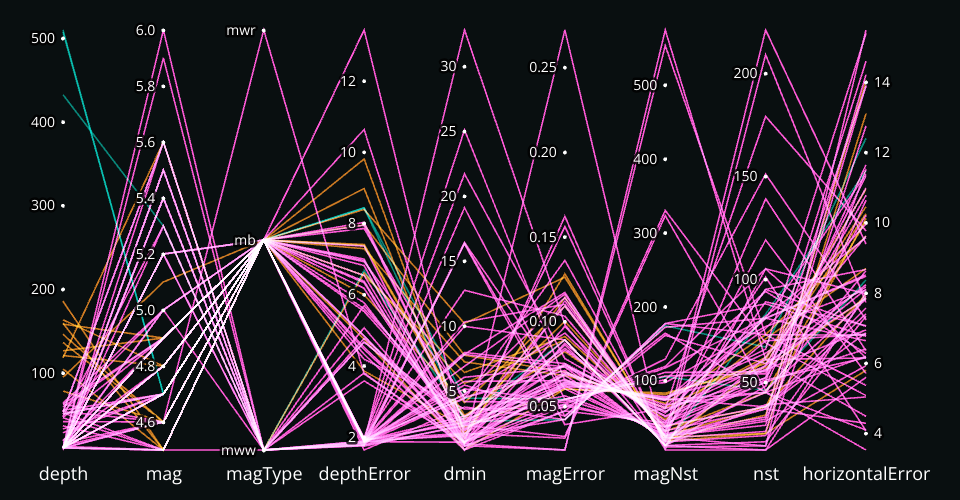
This dataset contains the infomation of the earthquakes with magnitude of more than 4.5 in the past 7 days. The purpose of using this dataviz is to examine what are the factors that affect the accuracy of the reported events.
The color of the lines were based on the depth of the earthquakes:
PINK: Shallow: depth < 70km
ORANGE: Intermediate: 70km <= depth < 300km
BLUE: Deep: depth >= 300km
Description of the x-axis labels:
depth - Depth of the event in kilometers.
mag -
The magnitude for the event.
mgType - The
method or algorithm used to calculate the preferred
magnitude for the event.
depthError - Uncertainty
of reported depth of the event in kilometers.
dmin - Horizontal distance from the epicenter to the
nearest station (in degrees). 1 degree is approximately
111.2 kilometers.
magError - Uncertainty of
reported magnitude of the event.
magNst - The total number of seismic stations used to calculate the magnitude for this earthquake.
nst - The total number of seismic stations used to
determine earthquake location.
horizontalError - Uncertainty of reported location of the event in kilometers.
more info
Observation:
- In general, smaller dmin gives more reliable calculated depth. However this plot indicates no straightforward relationship in between dmin and depthError.
- The higher magNst, the lower magError.
- The higher nst, the lower error in all reported depth, magnitude, and location.