Resources
Contact
Pricing
🇺🇸
EN
Log in
Open Editor
Revision History
Export Image
Share
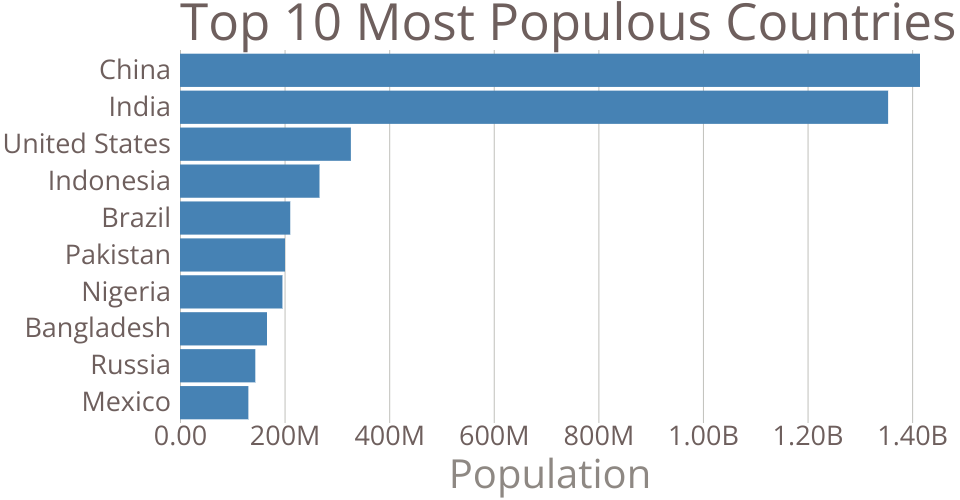
Customizing Axes of a Bar Chart with D3.js
1
Fork
0
Likes
Xin Li
0 views in last 90 days
Last edited Mar 21, 2021
Created on Mar 21, 2021
Forked from
Making a Bar Chart with D3.js and SVG
uses
v2 runtime
An example including some commonly used features of SVG.
MIT Licensed