Export Image
Export Code
Connected

Mobility Rate Bubble Chart

Arturo Galvan-Alarcon

Wednesday, May 14, 2025: 0 viewsThursday, May 15, 2025: 0 viewsFriday, May 16, 2025: 0 viewsSaturday, May 17, 2025: 0 viewsSunday, May 18, 2025: 0 viewsMonday, May 19, 2025: 0 viewsTuesday, May 20, 2025: 0 viewsWednesday, May 21, 2025: 0 viewsThursday, May 22, 2025: 0 viewsFriday, May 23, 2025: 0 viewsSaturday, May 24, 2025: 0 viewsSunday, May 25, 2025: 0 viewsMonday, May 26, 2025: 0 viewsTuesday, May 27, 2025: 0 viewsWednesday, May 28, 2025: 0 viewsThursday, May 29, 2025: 0 viewsFriday, May 30, 2025: 0 viewsSaturday, May 31, 2025: 0 viewsSunday, June 1, 2025: 0 viewsMonday, June 2, 2025: 0 viewsTuesday, June 3, 2025: 0 viewsWednesday, June 4, 2025: 0 viewsThursday, June 5, 2025: 0 viewsFriday, June 6, 2025: 0 viewsSaturday, June 7, 2025: 0 viewsSunday, June 8, 2025: 0 viewsMonday, June 9, 2025: 0 viewsTuesday, June 10, 2025: 0 viewsWednesday, June 11, 2025: 0 viewsThursday, June 12, 2025: 0 viewsFriday, June 13, 2025: 0 viewsSaturday, June 14, 2025: 0 viewsSunday, June 15, 2025: 0 viewsMonday, June 16, 2025: 1 viewTuesday, June 17, 2025: 0 viewsWednesday, June 18, 2025: 0 viewsThursday, June 19, 2025: 0 viewsFriday, June 20, 2025: 0 viewsSaturday, June 21, 2025: 0 viewsSunday, June 22, 2025: 0 viewsMonday, June 23, 2025: 0 viewsTuesday, June 24, 2025: 0 viewsWednesday, June 25, 2025: 0 viewsThursday, June 26, 2025: 0 viewsFriday, June 27, 2025: 0 viewsSaturday, June 28, 2025: 0 viewsSunday, June 29, 2025: 0 viewsMonday, June 30, 2025: 0 viewsTuesday, July 1, 2025: 0 viewsWednesday, July 2, 2025: 0 viewsThursday, July 3, 2025: 0 viewsFriday, July 4, 2025: 0 viewsSaturday, July 5, 2025: 0 viewsSunday, July 6, 2025: 0 viewsMonday, July 7, 2025: 0 viewsTuesday, July 8, 2025: 0 viewsWednesday, July 9, 2025: 0 viewsThursday, July 10, 2025: 0 viewsFriday, July 11, 2025: 0 viewsSaturday, July 12, 2025: 0 viewsSunday, July 13, 2025: 0 viewsMonday, July 14, 2025: 0 viewsTuesday, July 15, 2025: 0 viewsWednesday, July 16, 2025: 0 viewsThursday, July 17, 2025: 0 viewsFriday, July 18, 2025: 0 viewsSaturday, July 19, 2025: 0 viewsSunday, July 20, 2025: 0 viewsMonday, July 21, 2025: 0 viewsTuesday, July 22, 2025: 0 viewsWednesday, July 23, 2025: 0 viewsThursday, July 24, 2025: 0 viewsFriday, July 25, 2025: 0 viewsSaturday, July 26, 2025: 0 viewsSunday, July 27, 2025: 0 viewsMonday, July 28, 2025: 0 viewsTuesday, July 29, 2025: 0 viewsWednesday, July 30, 2025: 0 viewsThursday, July 31, 2025: 0 viewsFriday, August 1, 2025: 0 viewsSaturday, August 2, 2025: 0 viewsSunday, August 3, 2025: 0 viewsMonday, August 4, 2025: 0 viewsTuesday, August 5, 2025: 0 viewsWednesday, August 6, 2025: 0 viewsThursday, August 7, 2025: 0 viewsFriday, August 8, 2025: 0 viewsSaturday, August 9, 2025: 0 viewsSunday, August 10, 2025: 0 views
3 views in last 90 days
Last edited Feb 14, 2020
Created on Feb 14, 2020

Mobility Rate by College Bubble Chart

This example will demonstrate how to implement a bubble chart in D3.js version 5 with legends using d3-legend by Susie Lu.

The data comes from Opportunity Insights, which is a "non-partisan, not-for-profit organization based at Harvard University" that puts out public datasets produced for on their research.

We will specifically use data from the Mobility Report Cards project. The dataset is titled "Mobility Report Cards: Preferred Estimates of Access and Mobility Rates by College" and can be accessed via these direct links:

mrc_table1.csv
Codebook-MRC-Table-1.pdf

The original CSV file is replicated on this gist to avoid CORS issues when viewing this example on bl.ocks.org or blockbuilder.org.

We will filter this data to focus only on those universities located in California, which includes the University of San Francisco.

References

Tableau Prototype

Bubble Chart Prototype

See the Tableau Workbook for how to create this prototype. It is important to make sure count appears first on the marks card, which makes sure the smaller bubbles are drawn on top of the larger ones.

Below is the sheet description from Tableau to help rebuild it:

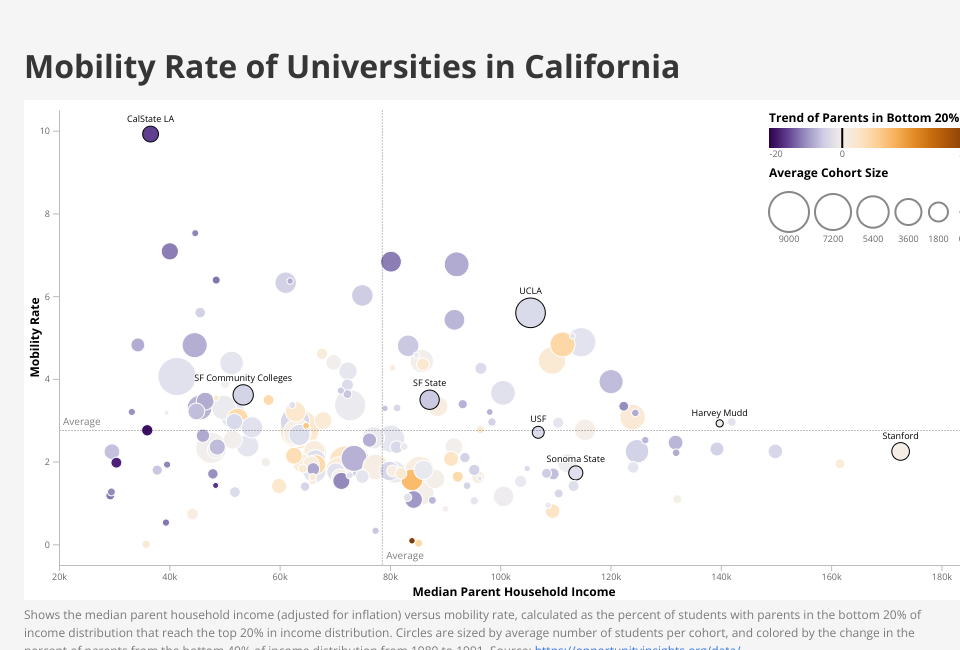
Description of "Mobility vs Income"

Median Parent Household Income vs. Mobility Rate. Color shows details about Trend of Parents in Bottom 20%. Size shows details about Average Children per Cohort. The marks are labeled by College Name. The data is filtered on State, which keeps CA.

Marks

The mark type is Circle. The marks are labeled by College Name. Stacked marks is off.

Shelves

Label Renamed Field Original Field
Rows: Mobility Rate mr_kq5_pq1
Columns: Median Parent Household Income par_median
Filters: State state
Text: College Name name
Color: Trend of Parents in Bottom 20% trend_parq1
Size: Average Children per Cohort count

Dimensions

  • Average Children per Cohort ranges from 50 to 8556 on this sheet.

  • College Name has 168 members on this sheet

    • Members: CalState LA; California State Polytechnic University, Pomona; Crimson Technical College; Glendale Community College; University Of California, Irvine; ...
  • State has 1 members on this sheet

    • Members: CA
  • Trend of Parents in Bottom 20% ranges from -17.57 to 31.79 on this sheet.

Measures

  • Mobility Rate ranges from 0.000 to 9.918 on this sheet.

  • Median Parent Household Income ranges from 29,300 to 172,600 on this sheet.

MIT Licensed