Resources
Contact
Pricing
🇺🇸
EN
Log in
Open Editor
Revision History
Export Image
Share
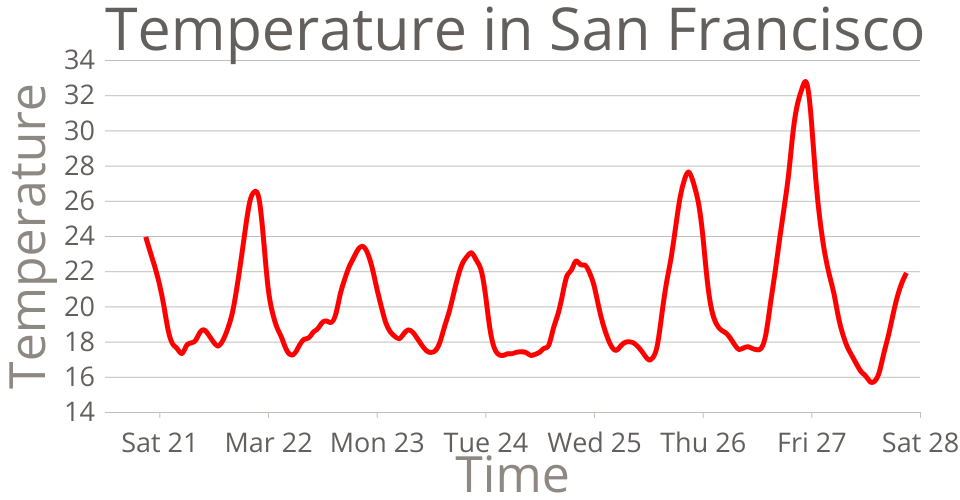
Temperature in San Francisco-line chart
1
Fork
0
Likes
Krishu
0 views in last 90 days
Last edited Aug 10, 2020
Created on Aug 10, 2020
Forked from
Temperature[line chart]
uses
v2 runtime
This scatter plot shows data about cars, from
UCI Machine Learning Repository: Auto MPG Data Set
.
MIT Licensed