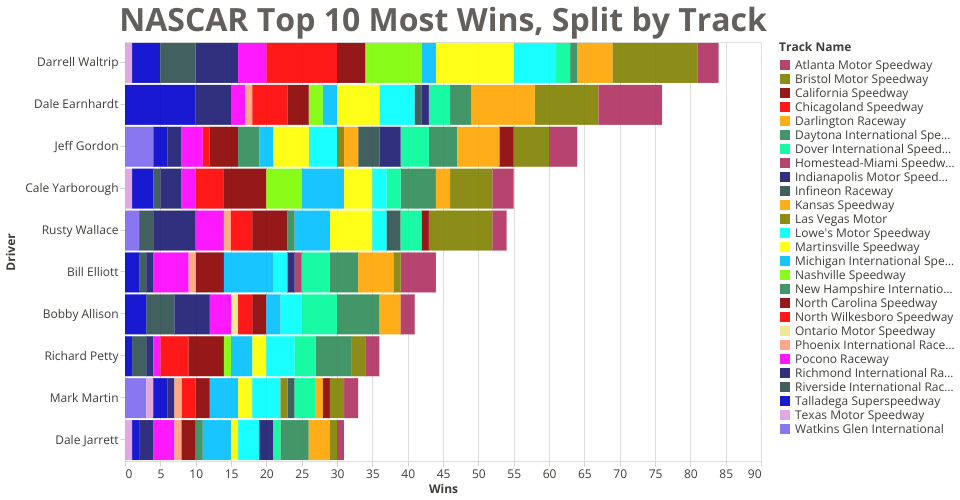
This bar chart displays the top 10 drivers in terms of wins in the dataset, with the bars broken down and colored by their wins at particular tracks. So, for example, the driver Darrell Waltrip leads drivers during this time period with 84 wins, and those wins are split by the tracks they occured at. A tooltip was added to display the track name, and the number of wins there. In order to display just the top 10, a variable was added to the dataset called "IsInTop10" and added to rows for those drivers. This data comes from a rendition of the NASCAR dataset, which spans from 1975 to 2003.
Goal: When added to the dashboard, I would like this viz to highlight the portion of the bars pertaining to the selected track.
MIT Licensed