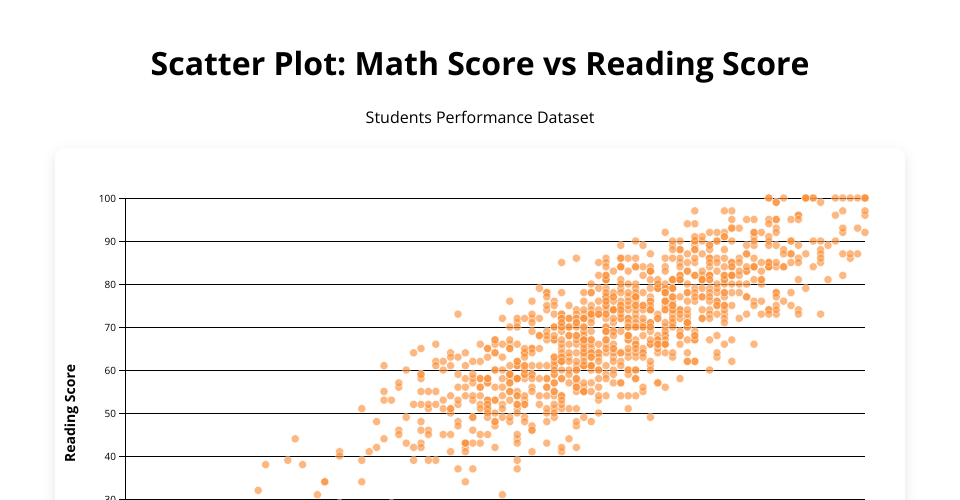
This scatter plot visualizes the relationship between math scores and reading scores from the student performance dataset. Each point represents a student, allowing us to observe the positive correlation between performance in mathematics and reading.
MIT Licensed