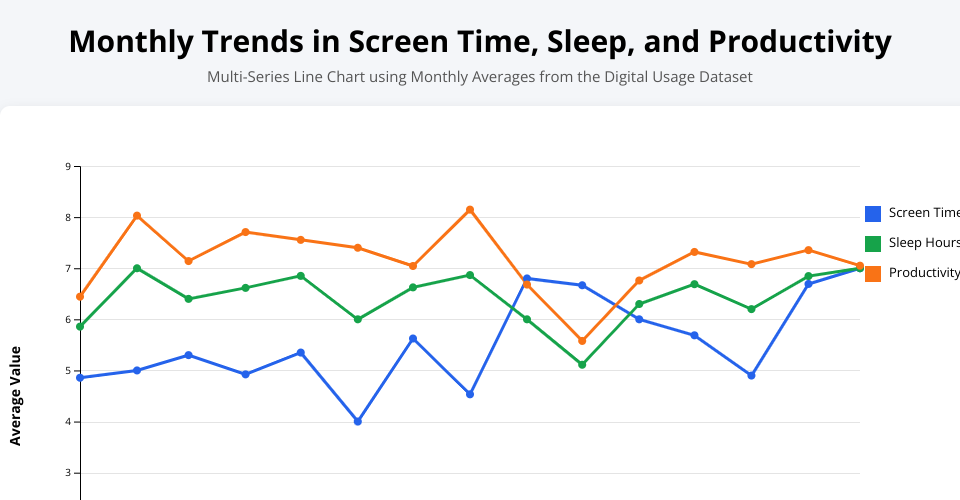
This chart shows monthly trends in screen time, sleep hours, and productivity using aggregated averages from the digital usage dataset. It allows comparison of how these behavioral metrics change over time and highlights differences among the three variables.
MIT Licensed