📊 ICE-5: Digital Distraction Dataset Visualization
Overview
This project demonstrates loading and analyzing a CSV taset sing D3.js. he dataset represents synthetic gital behavior ecords including app usage time, sleep urs, device nformation, and social media platform tivity.
The CSV file is hosted publicly via a GitHub Gist RAW link nd is dynamically loaded into the visualization using fetch()`.
Dataset Information
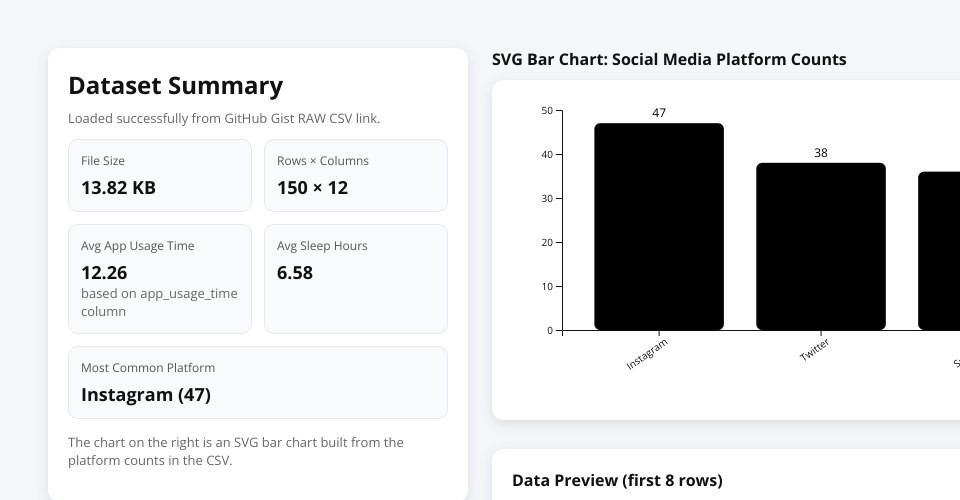
*_File Type: CSV _Rows: 150 Columns: 12 *Key Attributes:
_app_usage_time
_sleep_hours
_social_media_platform
_device_brand
_location
_mood_score
The dataset was generated using Mockaroo to simulate ealistic digital usage patterns.
Implementation Details
This visualization uses:
*-D3.js (v7) for:
_Parsing CSV (d3.csvParse)
_Data aggregation
d3.rollups)
*-SVG rendering (bar chart)
*-- Native JavaScript fetch() for data loading
-HTML +
CSS for layout and styling
Features Implemented
✔ Dataset metadata summary Computed KPIs:
*_File size (KB) _Rows × Columns _Average app usage time *_Average sleep hours -Most common social media platform ✔ VG bar chart showing latform distribution Scrollable review table (first 8 ows)
How It Works
- The CSV is fetched from a public GitHub Gist RAW URL.
- The CSV text is parsed into structured data using D3.
- Summary statistics are computed.
- Platform frequency counts are aggregated.
- An SVG bar chart is rendered dynamically.
Technical Learning Objectives
This project demonstrates:
*_Client-side data loading from remote sources _Data arsing and transformation _Aggregation using D3 utilities *_Basic SVG chart construction -Dynamic DOM updates
Author
Saiteja