Stacked Bar Chart - NYC Collision Data
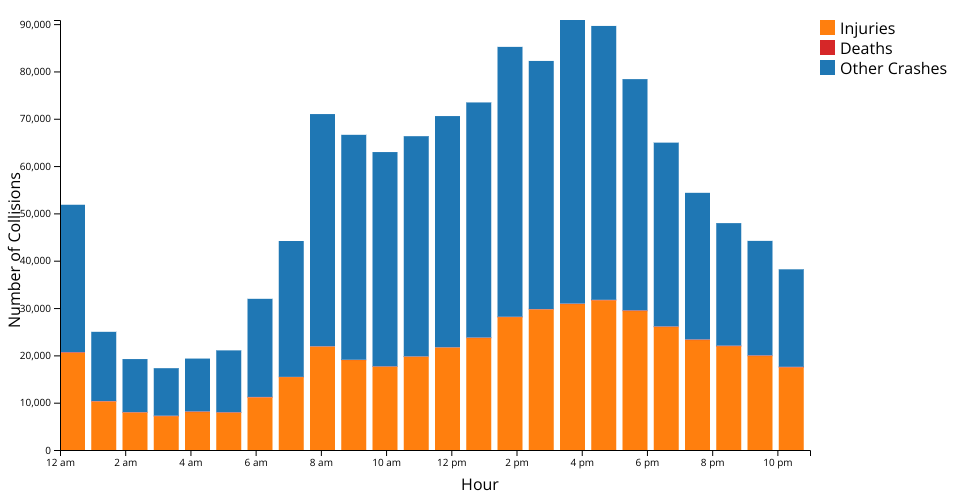
This visualization shows a stacked bar chart of NYC collision data by hour, displaying injuries, deaths, and other crashes.
Interactions
- Hover over the legend items to highlight the corresponding bars in the chart
- Hovered bars are highlighted with a black stroke and brought to the front
- Non-hovered bars fade to 20% opacity when hovering
Data
The data shows hourly collision statistics including:
- Total injuries
- Total deaths
- Remaining crashes (crashes without injuries or deaths)
MIT Licensed