Interactive Scatter Plot for EDAV-Final-Project
Part-5 Interactive component in D3:
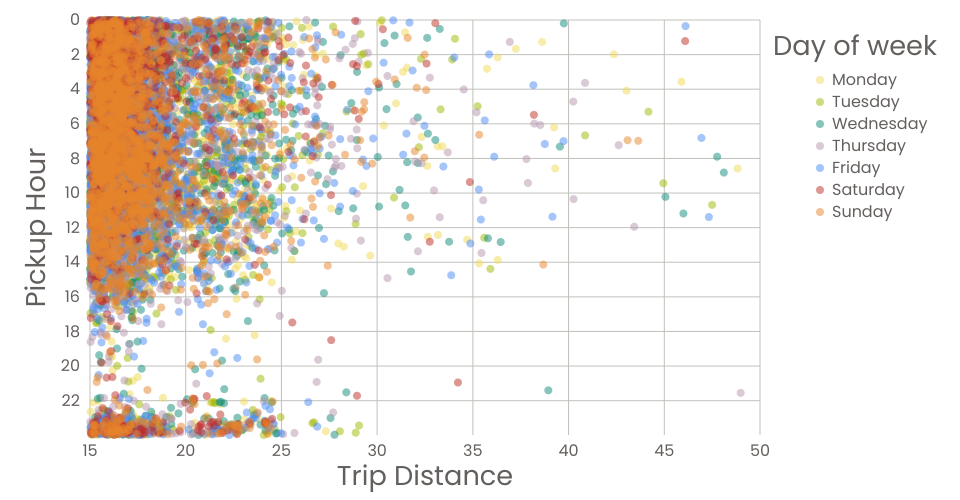
This scatter plot helps to look into the third research question in our project:
What is the most likely time period for a long distance ride?
The size of original data is too large to show on Vizhub, so we choose a subset of the whole data
Data:
- Only use the trip record data in Jun 2022
- Only focus on the trip data that LaGuardia Airport as the drop off location
- Only choose "Long distance trip", by limiting trip distance from 15 miles to 50 miles
- Data file url for this scatter plot: https://raw.githubusercontent.com/Jiahao-B-Lai/my-travel-plans/master/long.csv
Instruction:
This graph is able to show the distribution of long distance trips to LGA-Airport in individual day of the week. Hover over one of seven options on the "Day of week" color legend, then the trip data for a specific day of the week will show clearly.
MIT Licensed