Wedding Photography Market Growth Visualization
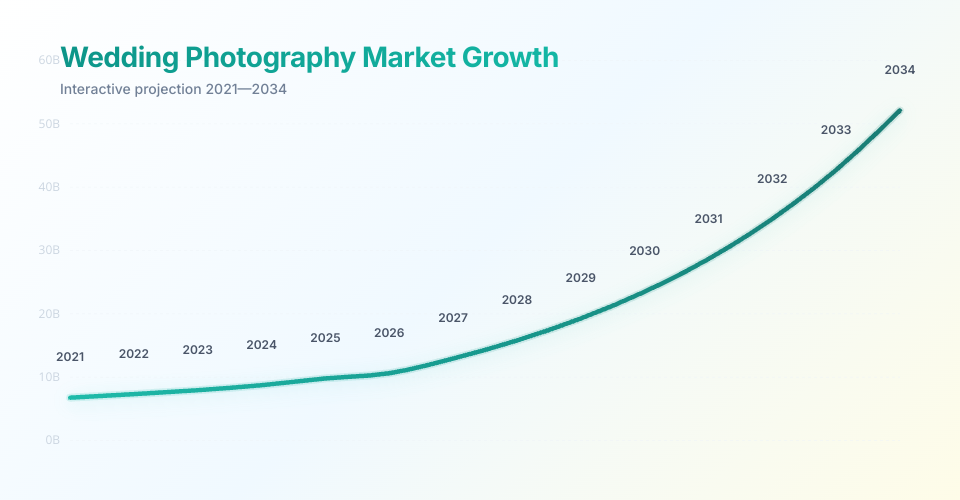
An interactive D3.js data visualization showing exponential market growth over time, with flowers positioned along a smooth upward curve.
Features
- Flower Glyphs: Each year is represented by a beautiful, multi-layered flower glyph
- Growth Curve: Flowers are connected by a smooth gradient line showing continuous upward market trajectory
- Vertical Positioning: Each flower's vertical position directly represents market size (USD Billion)
- Horizontal Time Axis: Follows chronological progression from 2021 → 2034
- Interactive Tooltips: Click or hover on any flower to see detailed market information
- Animated Entry: Staggered animation reveals the growth story from left to right
- Keyboard Accessible: Full keyboard navigation support (Tab + Enter/Space)
- Responsive Design: Adapts seamlessly to different screen sizes
Data
The visualization shows the Wedding Photography Market growth from 2021 to 2034:
- Starting value (2021): $6.68 Billion
- Projected value (2034): $52.04 Billion
- Total growth: ~679% over 13 years
All values follow a smooth exponential growth curve with year-over-year growth rates.
Visual Encoding
- Vertical Position: Represents market size (USD Billion) - flowers rise higher as market grows
- Horizontal Position: Time axis from 2021 → 2034
- Flower Size: Scales proportionally with market value (0.75x to 1.45x)
- Color: Teal gradient representing continuous growth and vitality
- Petal Layers: Two layers for visual depth and organic feel
- Connecting Line: Smooth upward curve connecting all flowers, forming a continuously rising growth trajectory
Design Metaphor
Flowers are positioned along a smooth upward growth curve:
- Each flower's height represents its market value
- The connecting line forms a continuously rising trajectory
- Together they create a visual story of organic, sustained growth
Interaction
- Hover: Preview data with animated ring effect
- Click: Pin a year to keep tooltip visible
- Click Background: Deselect and hide tooltip
- Keyboard: Tab to navigate between years, Enter/Space to select
Technologies
- React 19.1.0
- D3.js v7.9.0
- Modern CSS with gradients, animations, and transitions
- ES6 Modules via importmap
Design Inspiration
The flower metaphor draws from the OECD Better Life Index, where petals represent different dimensions. Here, the entire flower represents a moment in time, with its vertical position and size encoding market data in an approachable, organic visual form. The smooth upward curve emphasizes continuous growth.
Performance
- Optimized D3 join patterns for minimal DOM manipulation
- Memoized data calculations
- Hardware-accelerated CSS transitions
- Efficient ResizeObserver for responsive updates
MIT Licensed