Resources
Contact
Pricing
🇺🇸
EN
Log in
Open Editor
Revision History
Export Image
Share
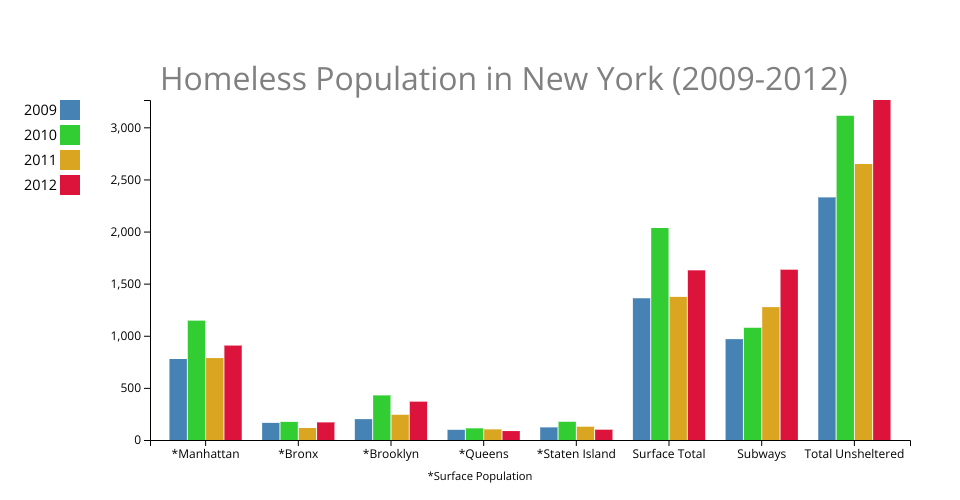
Bar Graph - New York Homeless Population (2009-2012)
11
Forks
2
Likes
JHamron
0 views in last 90 days
Last edited Mar 18, 2021
Created on Mar 09, 2021
Forked from
Let's make a face with D3.js!
uses
v2 runtime
There wasn't a lot of data so I just found ways to display the entire dataset for both.
MIT Licensed