Count of video games released by genre over time.
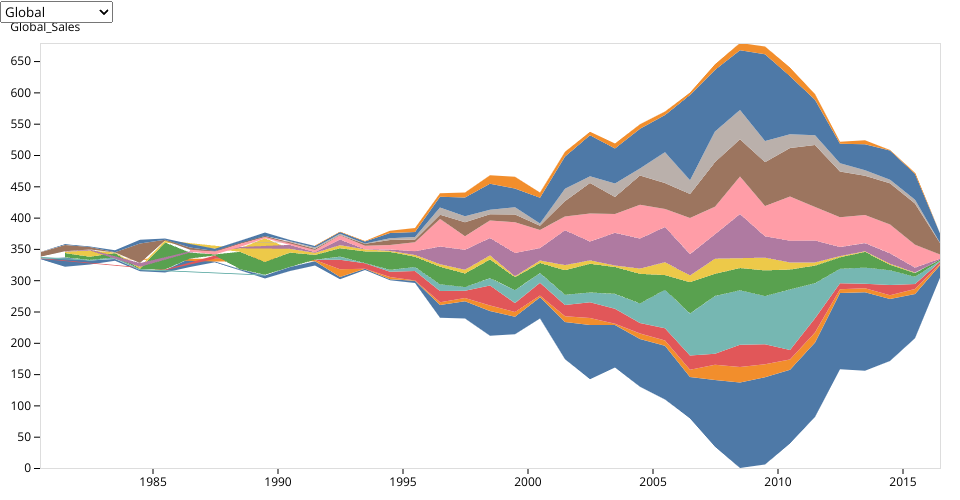
An exploration of the Video Game Sales Dataset prepared by Daniel Ribaudo, originally visualized in Interaction Fork of History of Video Games by Genre.
This is an extension of the forked Viz which includes 1 notable change:
- Rather than small multiples, there is a steamgraph (centered area chart).
Comments:
This was done mostly as an exploratory modification to the existing visualization. It is much harder to answer questions such as:
- Which regions prefer which genre the most?
- Which genres have been more or less popular with the passing of time?
It is easier to answer:
- How do annual video game sales vary per year in each country?
TODO:
- To my knowledge, the plot functionality does not automatically come with a key/legend. This needs to be implemented to make sense of the colors.
- I must investigate the wierd effect occuring at the beginning of the graph.
Uses Observable Plot with vanilla HTML.
MIT Licensed