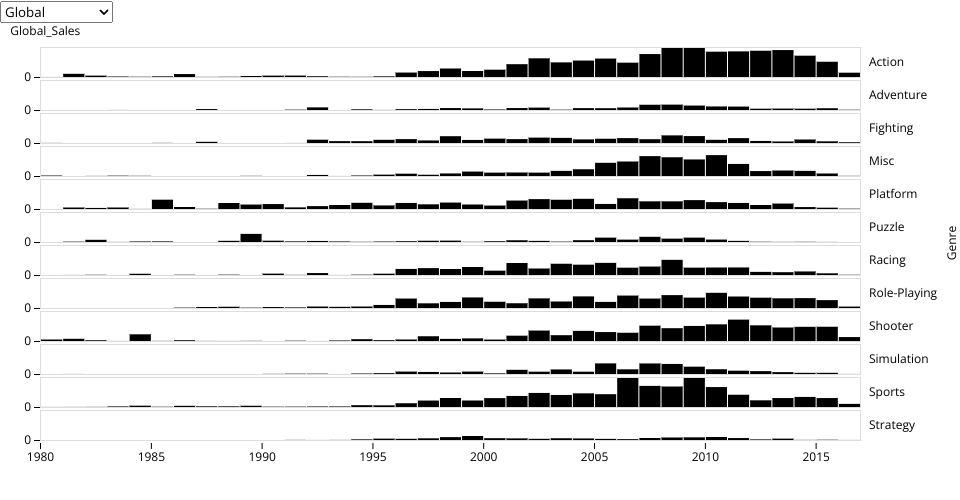
Sales of video games released by genre over time.
An exploration of the Video Game Sales Dataset prepared by Daniel Ribaudo, originally visualized in History of Video Games by Genre.
This is an extension of the forked Viz which includes 2 notable changes:
- Rather than count (which would record the total number of games released within a genre), I have instead included a summation of the sales that each genre had during that year.
- Rather than only displaying global values, I have added a dropdown menu that allows a user to select which region they would like to view.
Comments:
I very much enjoyed the basic idea of this graph. It helped answer one of the questions associated with this dataset, namely: Which genres have been more or less popular with the passing of time? It provided a very concise comparison between the years for each genre, and allowed users to compare trends between two genres.
One difficulty I had was in searching through the Observable Plot API. Most of it seems to be related to using their custom notebooks browser editor. Mostly, I wanted to use the proper data flow for interaction, but it seemed their interaction based modules were only for the notebook they created. Therefore, I resorted to just redrawing the entire graph, which I understand is inefficient.
Uses Observable Plot with vanilla HTML.