A vanilla HTML implementation of a D3 scatter plot.
Forked and authored by Daniel Ribaudo.
The data comes from this Gist: EU Vaccinations
Within this dataset, city names are provided alongside their latitude, longitude, and population.
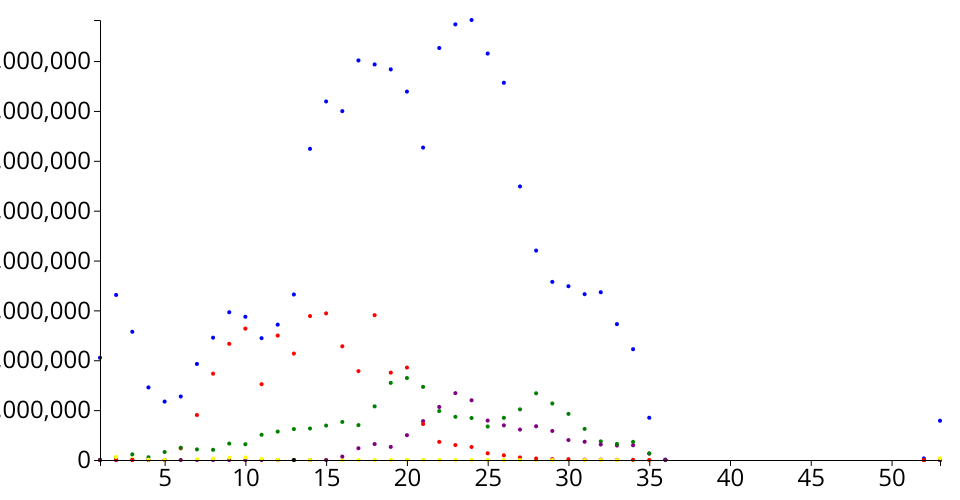
Within this fork, I tested aggregating data using d3 functionality. I aggregated FirstDose by YearWeekISO, Vaccine. This was done to prepare myself for the prototype assignment.
MIT Licensed