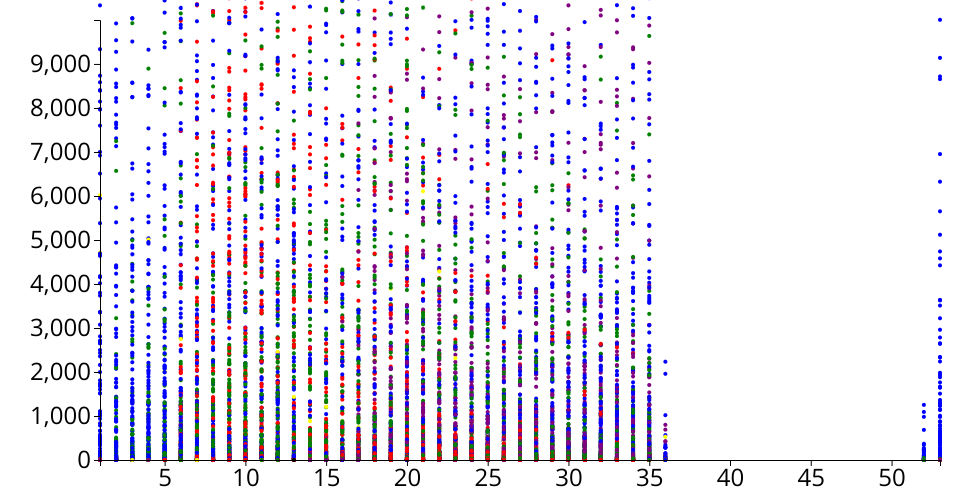
A vanilla HTML implementation of a D3 scatter plot.
Forked and authored by Daniel Ribaudo.
The data comes from this Gist: EU Vaccinations
Within this dataset, city names are provided alongside their latitude, longitude, and population.
I added comments to this file to demonstrate understanding of various pieces of code. I edited the required segments (import, circle radius, and circle opacity) as well as other segments (color of the plot points, bounds of the margin to allow the full numbers to be displayed).
One issue with this data is that it needs to be aggregated in some way to work in this format. One way of doing this would be to sum rows which have the same YearWeekISO and Vaccination type, as these are only different by area. As of right now, there is too much going on in this one graph.