A vanilla HTML implementation of a D3 scatter plot.
Forked and authored by Daniel Ribaudo.
This is the link to the Gist: Geonames Cities
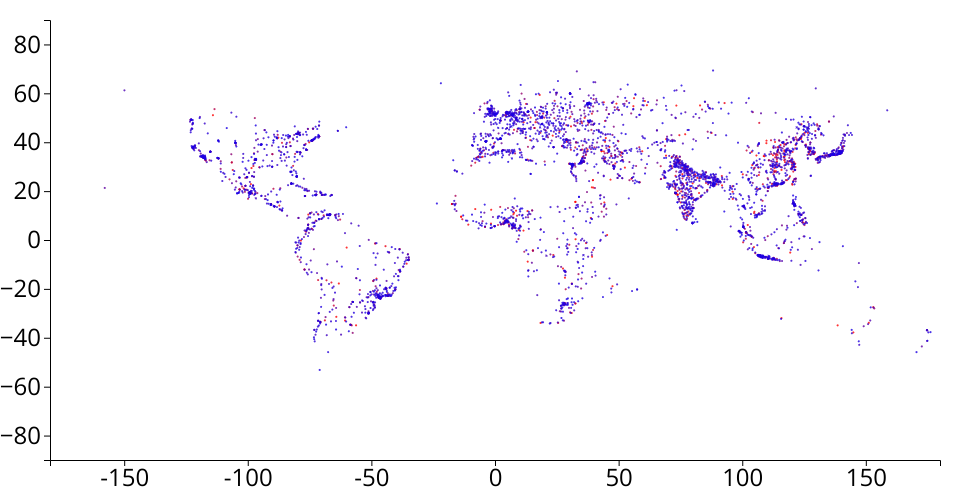
Within this dataset, city names are provided alongside their latitude, longitude, and population.
I added comments to this file to demonstrate understanding of various pieces of code. I edited the required segments (import, circle radius, and circle opacity) as well as other segments. I interpolated between colors using d3.interpolate to communicate the population in a city. Blue is lower population and red is higher population. I manually scaled the axis between [-90, 90] for y (latitude) and [-180, 180] for x (longitude). These bounds follow the boundaries on these values, rather than be based on the dataset. It is wonderful that such a clear map of the world is within this image.