Forked and authored by Daniel Ribaudo.
This is my visualization for the week. I'm really happy how it turned out, and I feel like I put a lot of good effort into it.
The data visualized comes from this gist: Video Game Sales
Within this dataset, there is a listing of video game sales per country. Each video game listed is labelled with a genre, year, publisher, and platform.
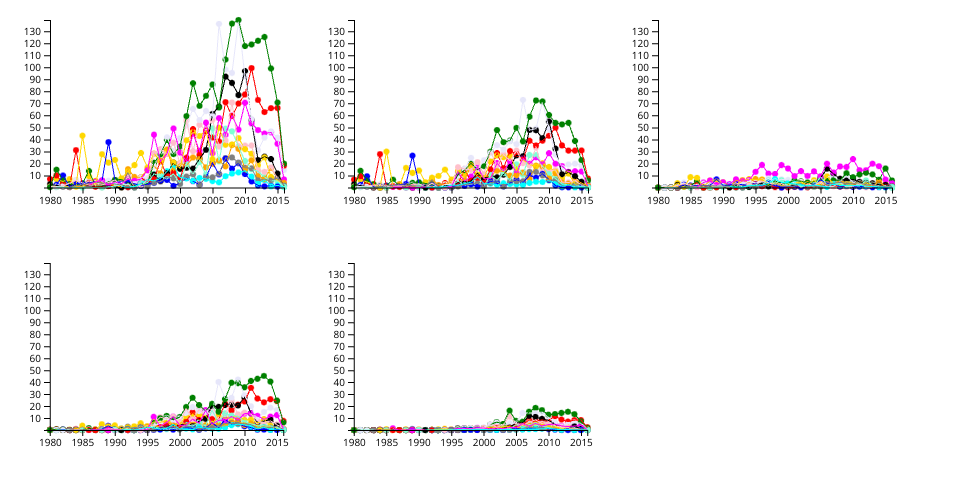
Description:
Each chart is sales for each genre of video game plotted against time. The first chart is global sales, the second is North America, third is Japan, fourth is the EU, and finally all other sales. A user may click on the graph to form a crosshair on their cursor. This functionality more easily allows points to be compared across charts.
Code Explanation:
The way the data is loaded and parsed is initially very similar to the scatter plot the data is forked from. The sales for each game are then aggregated by the given key (right now, genre) via the rollupSales function. This function uses d3.flatRollup [ requires a separate submodule import from unpkg ] to perform this functionality.
I also calculate the size of each graph by using a square root to try to make the arrangement as square as possible. I use a d3 enter to append multiple svgs, and .each to run a set up function on each of them. I used a mix of circles and polylines to represent the data. I manipulated both of these with an d3 data join on the rolled up data.
After the initial selection of svgs, I used that same selection to register mouse event handlers on the svgs. I used a curried function to retain some variables that I wished to pass to the resulting lambda. I pass the entire selection to this function so that it can update all of the svgs.
Finally, I was not sure how to select lines that already existed within the svg because of the ticks on the axes, so I added an arbitrary property (code smell that I'll need to fix) to them and filtered based on whether the objects in the selection had the property.
Next steps:
- A key explaining each of the colors
- Code smell fixes (calculate aggregate data once, more modularity, less magic values)
- Titles at the top of each graph
- The ability to toggle each graph and re-render
- The ability to render different data within the csv
- The ability to toggle various lines/colors
- Zoom and drag (seems to be a native svg function)