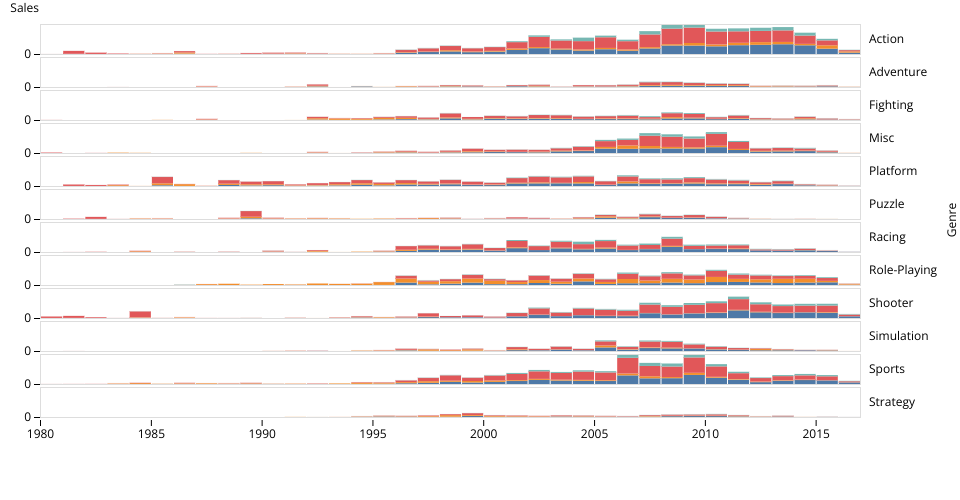
Count of video games released by genre over time.
An exploration of the Video Game Sales Dataset prepared by Daniel Ribaudo, originally visualized in Interaction Fork of History of Video Games by Genre.
This is an extension of the forked Viz which includes 2 notable changes:
- The bars are stacked to show the contribution from each set of sales (NA, EU, JP, and Other). This was done by creating a modified dataset before passing it into the plot function.
- Interaction was removed, as this would be largely redundant when the different types of sales are already visually encoded.
Todo:
- To my knowledge, the plot functionality does not automatically come with a key/legend. This needs to be implemented to make sense of the colors.
Uses Observable Plot with vanilla HTML.
MIT Licensed